Last updated: April 09, 2024
Daily monitoring of data quality
Read this guide to understand the daily workflow of using DQOps to review recently detected data quality issues.
Overview
Problem: To ensure the accuracy, completeness, consistency and reliability of your data, it is essential to monitor it on a daily basis. By doing so, you can spot any issues early on and take prompt action to solve them.
Solution: To achieve this, you can set up daily monitoring of data quality checks in the DQOps. The platform will automatically run data quality checks on a regular basis and notify you immediately if it discovers any issues. Additionally, you can review the results of the checks on data quality dashboards, which provide a comprehensive overview of your data quality status.
Import a new table
To import tables, you first need to have added connection. You can check supported data sources and a guide how to add a new connection here.
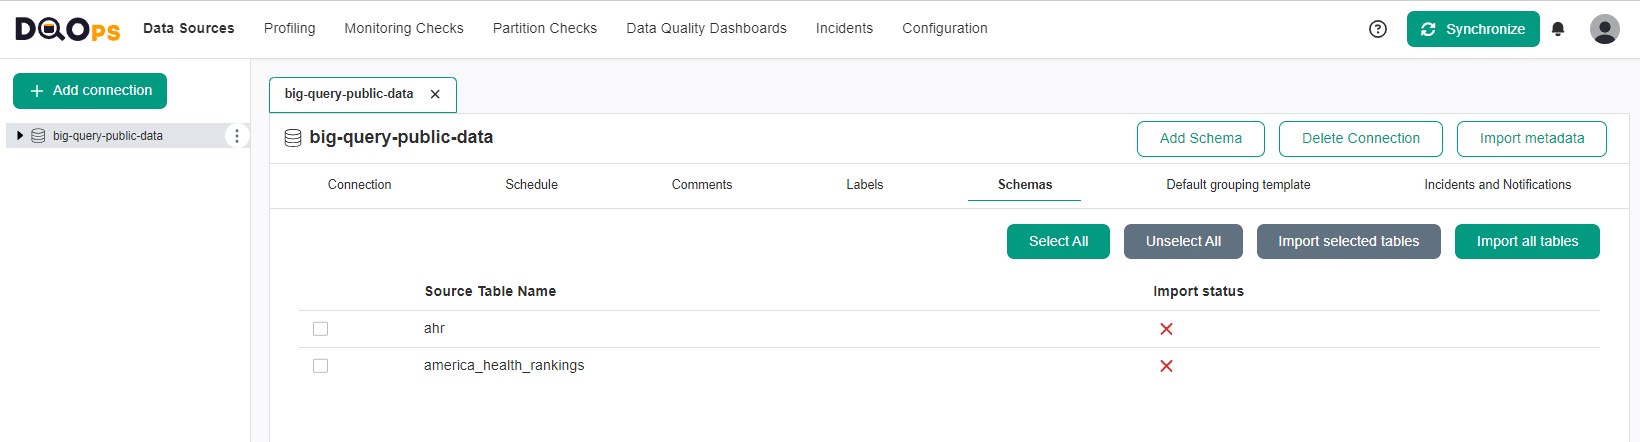
To import source schemas and tables:
- Go to the Data Sources section
- Select the connection from the tree view on the left
-
Click on the Import metadata button on the right.

-
Select the source schema name you want to import by clicking on the Import tables button.

-
Select the tables you want to import or import all tables using the buttons in the upper right corner.
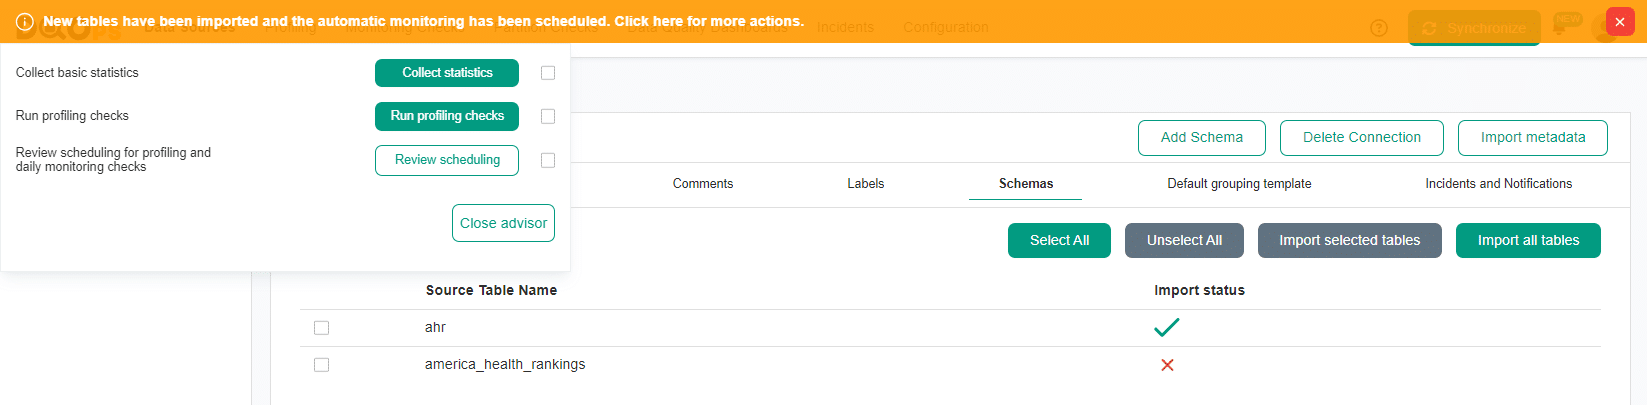
When new tables are imported, DQOps automatically activates profiling and monitoring checks, and opens an Advisor that allows you to quickly collect basic statistics, run profiling checks, or modify the schedule for newly imported tables. But let's close the Advisor with the X button in the top right corner and verify the activation of the default checks.
Verify activation of the default checks
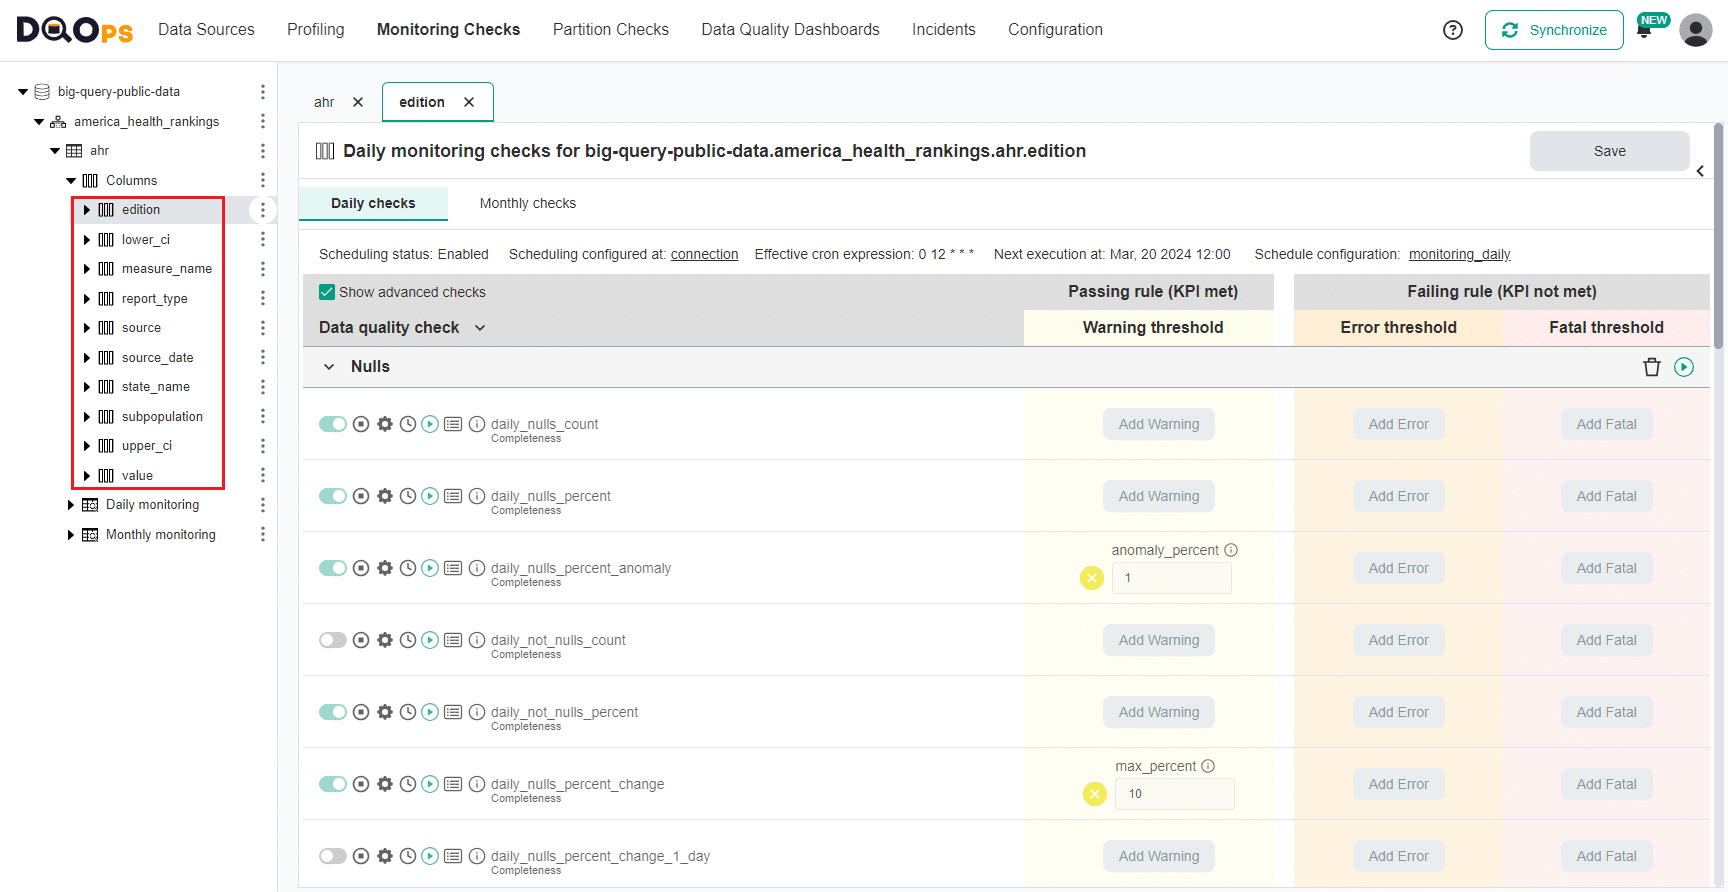
To verify the activation of the default checks, go to the Monitoring checks section, select the table of interest from the tree view on the left and the Daily checks tab. The main workspace on the right will show the check editor. The toggle button next to the name of the activated default checks will have a light green color. If the check has been activated manually, the toggle button will have a darker green color.

Similarly, you can view the column checks. Just select the column of interest from the tree view on the left.
Verify schedule configuration
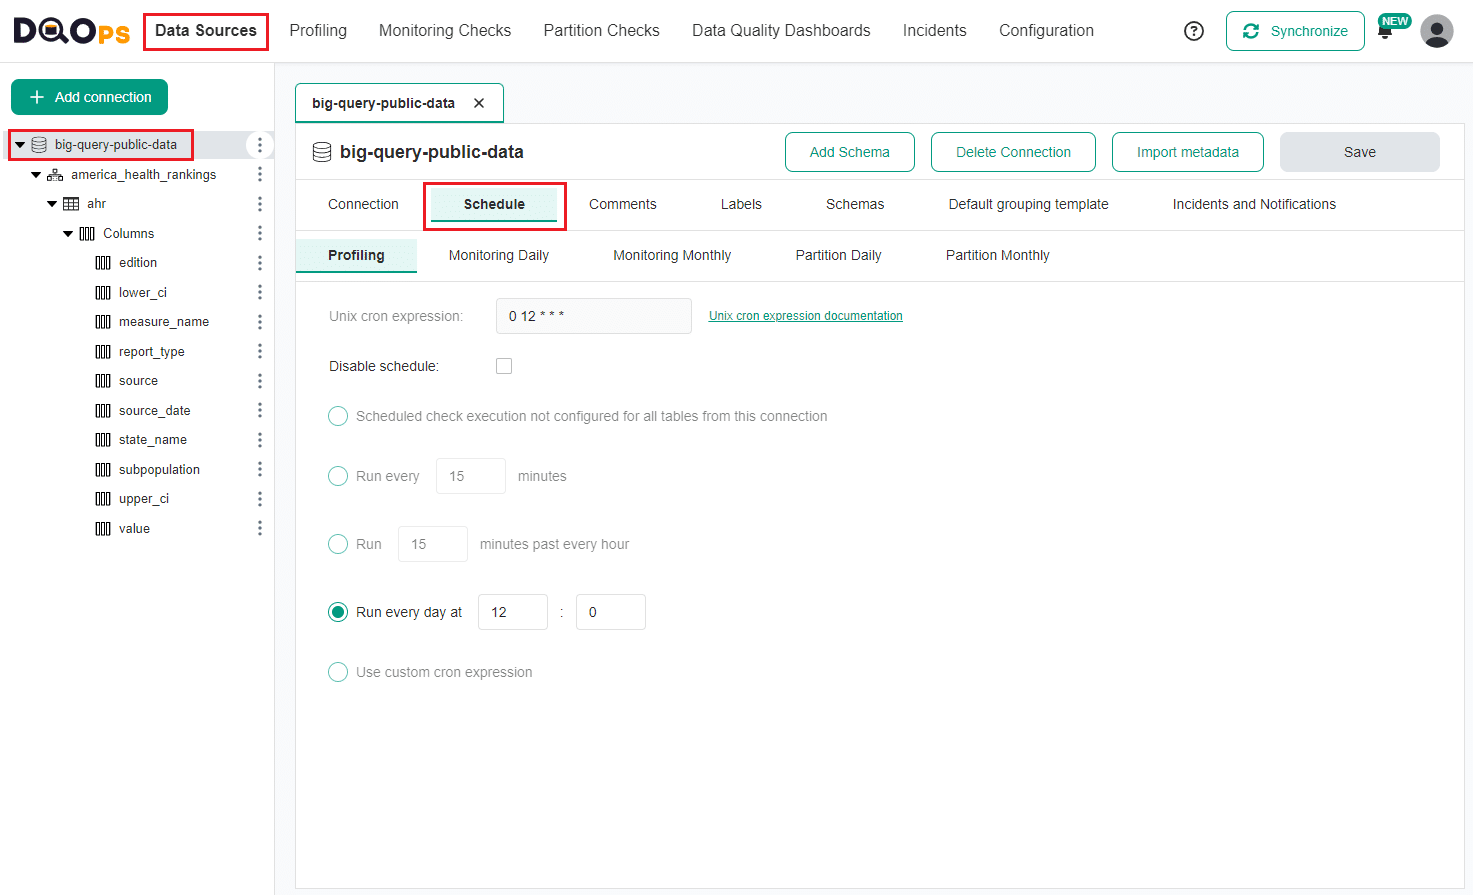
With DQOps, you can easily customize when checks are run by setting schedules. You can set schedules for an entire connection, table, or individual check. When you import a new table, DQOPs automatically set the schedule to run check daily at 12:00 a.m.
To verify and modify the current schedule, go to Data Source section, select the data source of interest from the tree view on the left, and click on the Schedule tab on the main workspace. You can modify the schedule for each type of checks separately
Run default checks
To run checks, navigate to the check editor: go to the Profiling or Monitoring Checks section, select a table or column from the tree view on the left, click on the Profiling checks or Daily Checks.

The table with data quality checks contains a list of checks divided into different data quality subcategories that you can expand and collapse by clicking on an arrow. Learn more about the different check subcategories.
The right side of the table allows setting different threshold levels (severity levels). Learn more about threshold levels
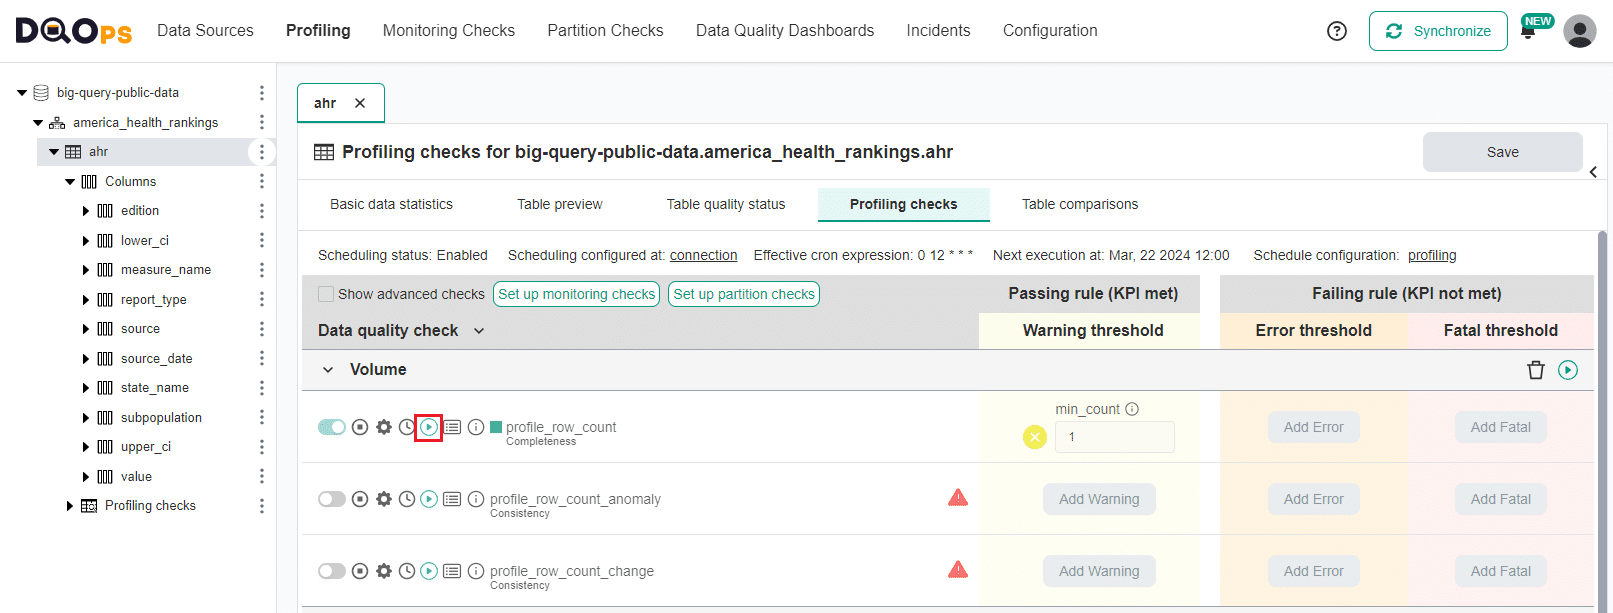
On the left of the name of each check, there are several buttons and icons that allows you to:
- Activate and deactivate checks by using the Switch button,
- Disable checks,
- Access check Settings,
- Check schedule status,
- Run data quality checks,
- View detailed results for Checks, Sensor readouts, and Execution errors
- View detailed information about check,
- Check the results of the run check shown as a color square
- Green for a valid result
- Yellow for a warning
- Orange for an error
- Red for a fatal error
- Black for execution error.
To run the check, just click on the Run check button.
You can also run all checks activated on connection or table. Click on the three dot icon next to the name of connection or table and click on the Run checks option.
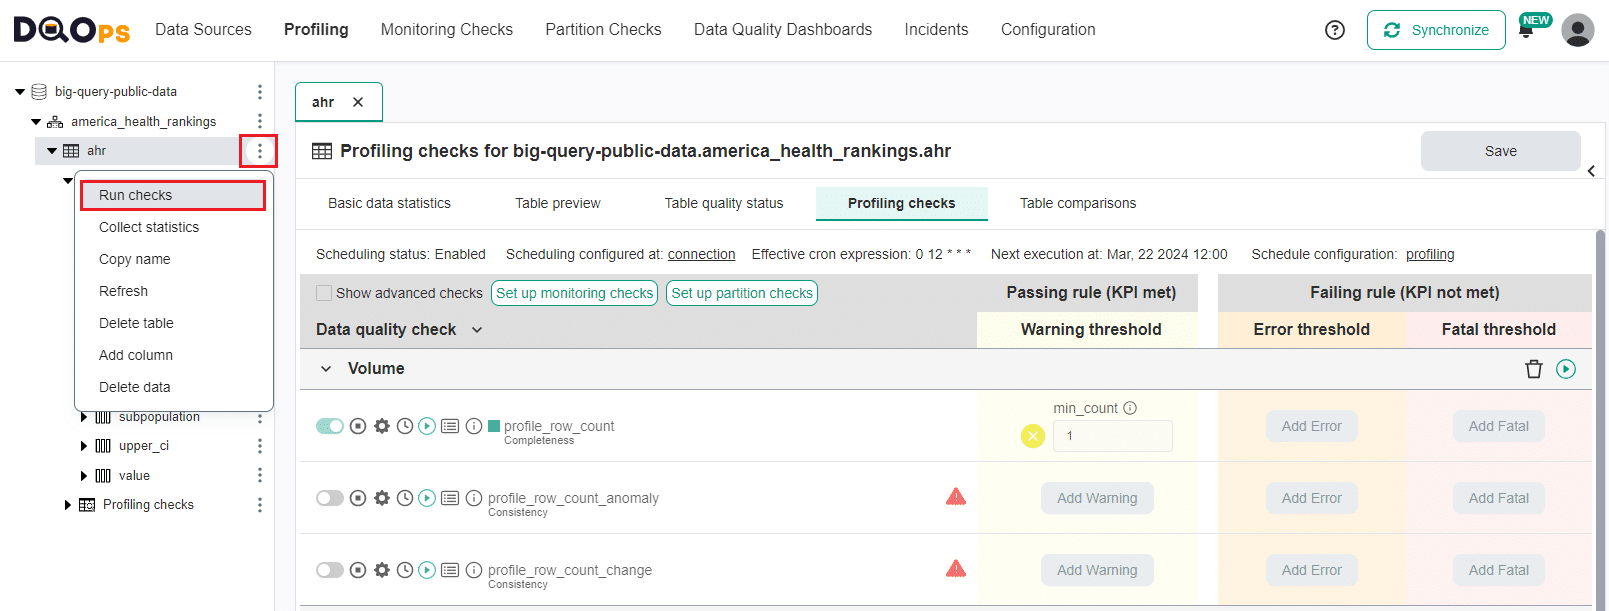
A dialog box will appear where you can modify different options or simply click the Run checks button.

Review the check results
To access the results click on the Results button.
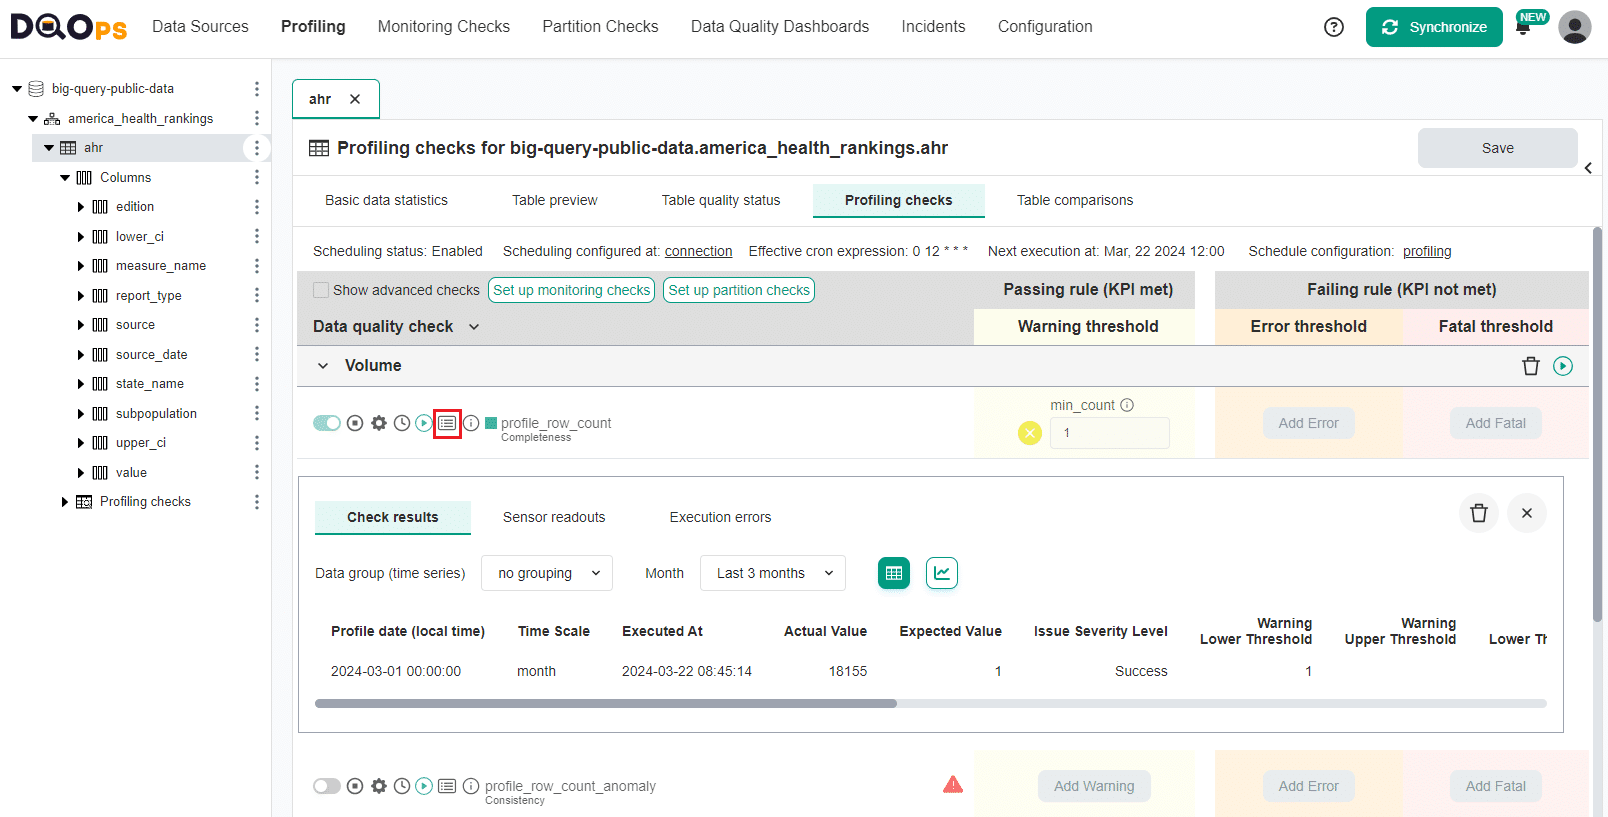
Within the Results window, you will see three categories: Check results, Sensor readouts, and Execution errors. The Check results category shows the severity level that result from the verification of sensor readouts by set rule thresholds. The Sensor readouts category displays the values obtained by the sensors from the data source. The Execution errors category displays any error that occurred during the check's execution.
Review the Incidents
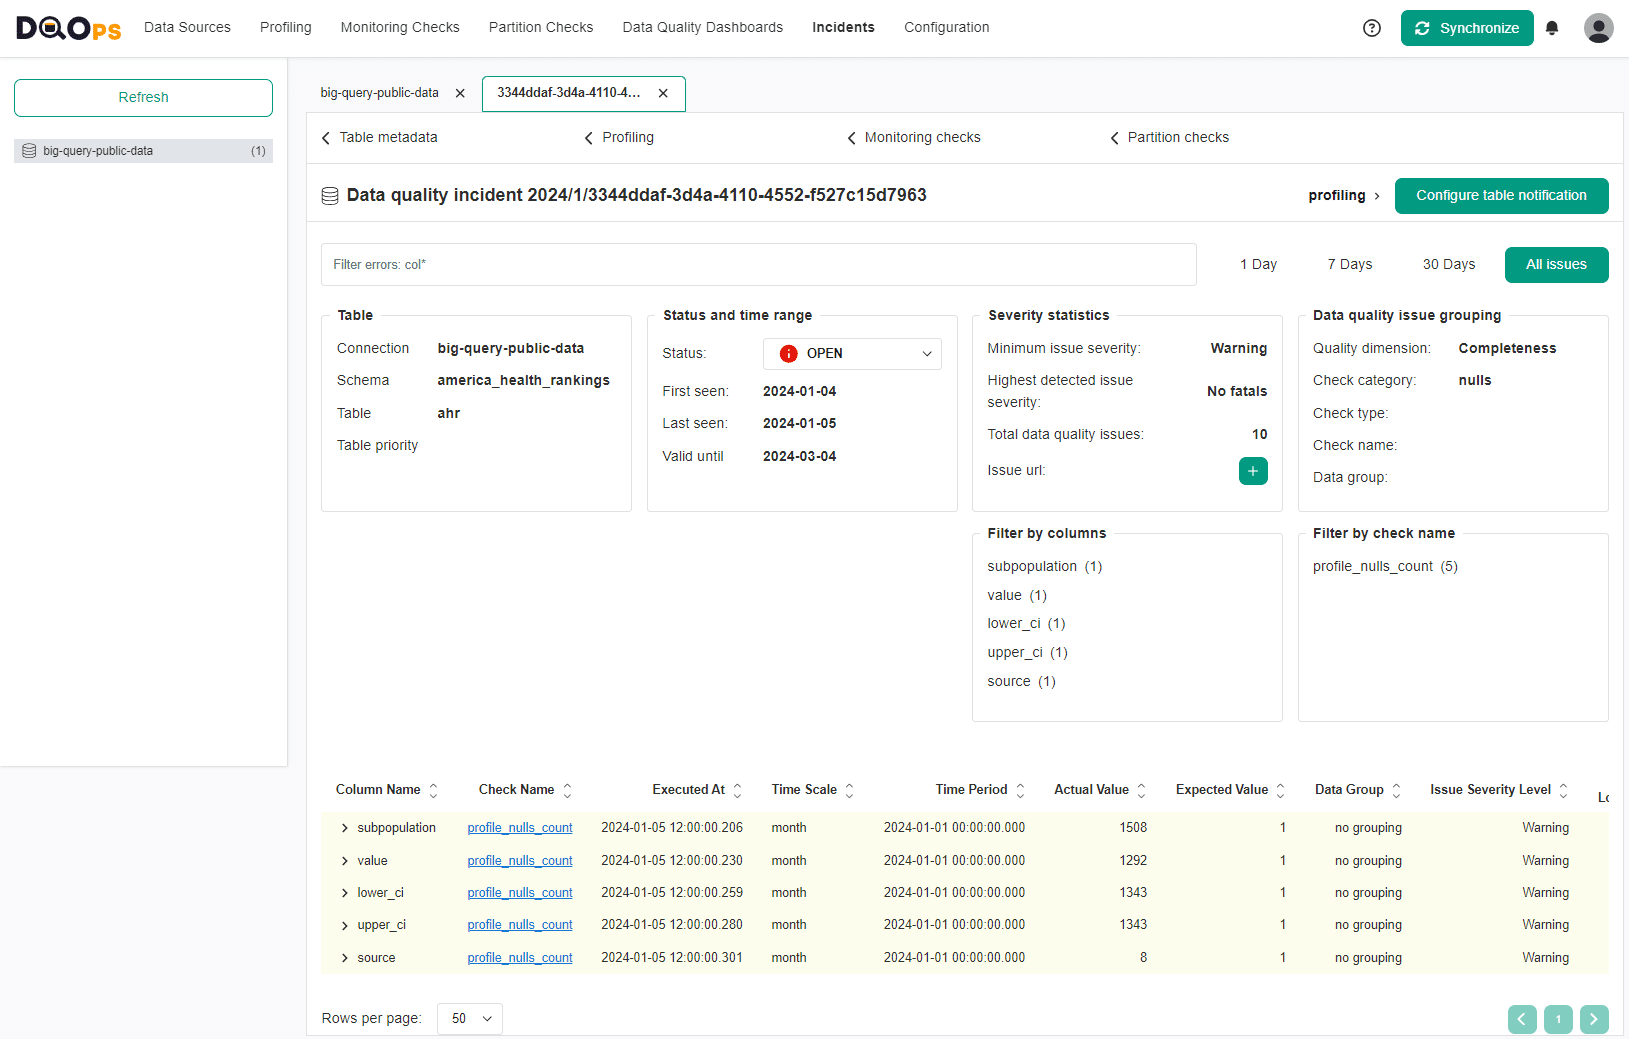
With the help of DQOps, you can conveniently keep track of the issues that arise during data quality monitoring. The Incidents section aggregates these issues into incident and allows you to view and filter them, as well as manage their status.
To review the if incidents go to the Incidents section. On the left side of this section, there is a list displaying the connections and the number of incidents that have occurred for each one. On the right panel, you can view incidents for the connections you have selected, and you can filter, sort, and view detailed information about the incidents.
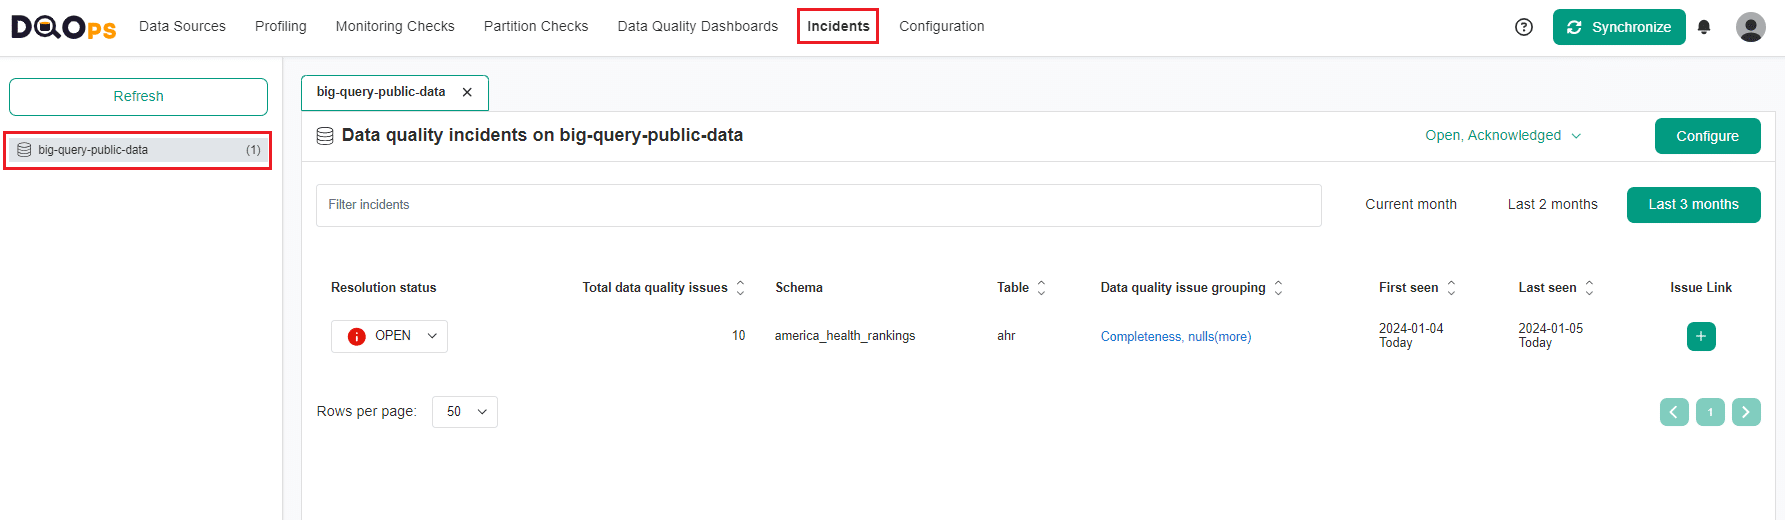
We can see that we have one incident with 10 data quality issues. To review more details click on the link in the Data quality issue grouping column.
Read the full description of the Incidents section here.
Configure notifications
DQOps can send alert notifications whenever a new incident is created or modified. Notifications allow you to monitor data in real-time and receive alerts when active data quality checks detects an issue.
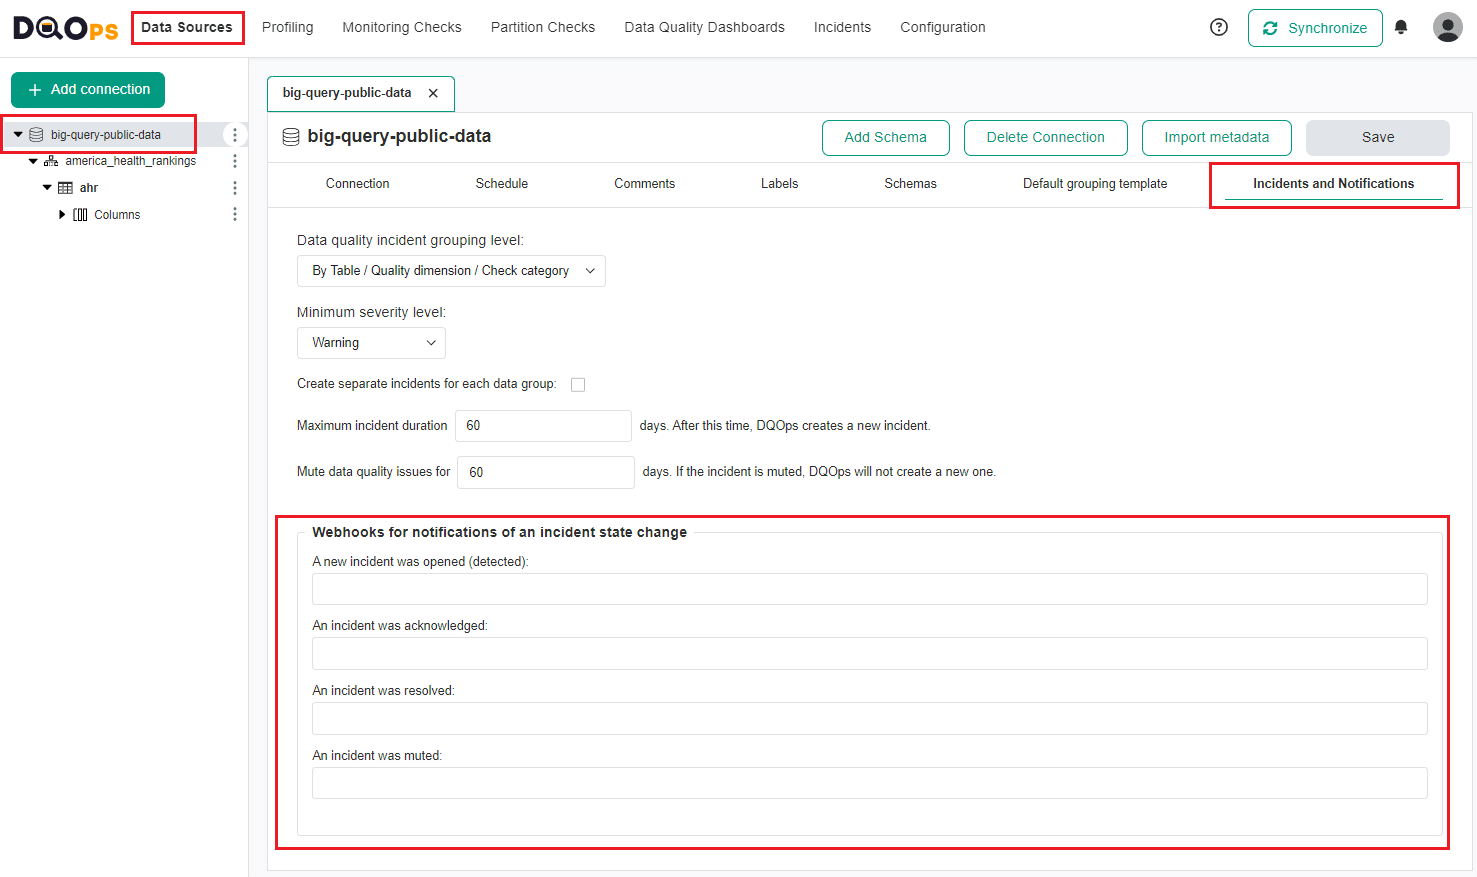
Configure Webhooks
To configure Webhooks, follow these steps:
- Go to the Data Sources section.
- Select the relevant data source.
- Select the Incidents And Notifications tab.
- Enter the Webhooks URL in the specified input fields and save your changes using the Save button.
Follow the link for more information about Webhooks.
Configure Slack notifications
DQOps supports integration with Slack Webhooks which are used to set up in-app Slack notifications.
Click the link for more information how to set up in-app Slack notifications.
Review the check results on dashboards
DQOps has multiple built-in data quality dashboards dedicated to analyzing results from data quality checks. You can learn more about different types of dashboards in the Concept section.
To be able to display results on data quality dashboards, you need to have a DQOps account and synchronize locally stored results with it.
To synchronize the data just click on the Synchronize button in the upper right corner of the navigation tab.
To view dashboards, simply go to the Data Quality Dashboard section, and select the dashboard of interest from the tree view on the left.
Below are examples of several dashboards.
Current table status dashboards
Current table status dashboards allow data engineers and data owners to quickly evaluate the data quality of monitored tables and columns. The dashboards display a color-coded status that indicates the severity level detected by run checks. When the status is green, it means that the monitored column has no data quality issues. However, if the status is yellow, orange, or red, it indicates that there were some issues detected. The dashboard also displays the number of detected issues per severity threshold, making it easier to identify and address tables and columns with issues.
These dashboards allow filtering data by:
- time frame,
- connection,
- schema,
- data quality dimension,
- check category,
- data group,
- table,
- column.
Current table status dashboard is a representative of this group.

Data quality KPIs
Data quality KPIs dashboards show high-level data quality KPIs, aggregated on a macro scale that can be shared at a corporate level. DQOps calculates data quality KPIs as a percentage of passed data quality checks for each connection, schema, data grouping, etc.
With these dashboards, senior management can review a summary of data quality KPIs or evaluate the KPIs per table, column, data quality dimensions, check category, data grouping and day.
KPIs per table and day is a representative of this group. It allows reviewing data quality KPIs per table and day of the month.
This dashboard allows filtering data by:
- current and previous month,
- connection,
- schema,
- data group,
- stage,
- priority,
- data quality dimension,
- check category,
- check name,
- column
- table,
- day of the month.

Data quality issues count
Data quality issues dashboards allow evaluation of the number issues and its severity level per table, or per check category. Another two types of dashboards in this subgroup allows reviewing the total number of failed checks (warning, error, fatal) per day of the month, or per table and day of the month.
Data quality failed checks per table and day is a representative of this group.
This dashboard allows filtering data by:
- severity
- current and previous month,
- connection,
- schema,
- stage
- priority,
- data group,
- data quality dimension,
- check category,
- check name,
- table,
- day of the month.

What's next
- You haven't installed DQOps yet? Check the detailed guide on how to install DQOps using pip or run DQOps as a Docker container.
- DQOps provide you with summary statistics about your table and column. This information can be valuable in deciding which data quality checks and threshold levels should be set to monitor data quality. For more details about Basic data statistics, click here.
- The data in the table often comes from different data sources and vendors or is loaded by different data pipelines. Learn how data grouping in DQOps can help you calculate separate data quality KPI scores for different groups of rows.