Last updated: April 09, 2024
Creating custom data quality checks
Read this guide to learn how to create a custom data quality check in DQOps using the user interface.
Overview
DQOps is a powerful tool that offers more than 150 built-in data quality checks. These checks consist of a sensor and rule. A sensor is a templated Jinja2 SQL query and is further validated by a Python data quality rule.
One of the best things about DQOps is that you can design custom data quality checks that will be supervised by the data quality team. This means that you have complete control over the data quality standards that are implemented in your organization. Furthermore, any custom checks that you create will be visible in the user interface, making it easy for everyone on your team to access and use them.
Creating a custom data quality check using UI
In this guide, we will show you how to create a custom check.
As an example, we will create a check that will verify that there is a valid DUNS number in a column. A data universal numbering system (DUNS) number is the most widely used method for identifying companies in the United States. DUNS number is a unique, nine-digit series of numerals.
The following is a fragment of the exemplary table with a column duns_number containing valid and invalid DUNS numbers.
| id | company_name | duns_number |
|---|---|---|
| 1 | 23andme Holding Co. | 117684369 |
| 2 | Dupont De Nemours, Inc. | 080386615 |
| 3 | Johnson & Johnson | 307081 |
| 4 | Pepsico, Inc. | 001287762 |
| 5 | The Procter & Gamble Company | PG |
Specifically, we will verify that the number of rows with invalid DUNS numbers in a column does not exceed the maximum accepted count. As a template for the custom check, we will use the daily_invalid_email_format_found column check
Navigate to custom checks, sensors, and rule editors
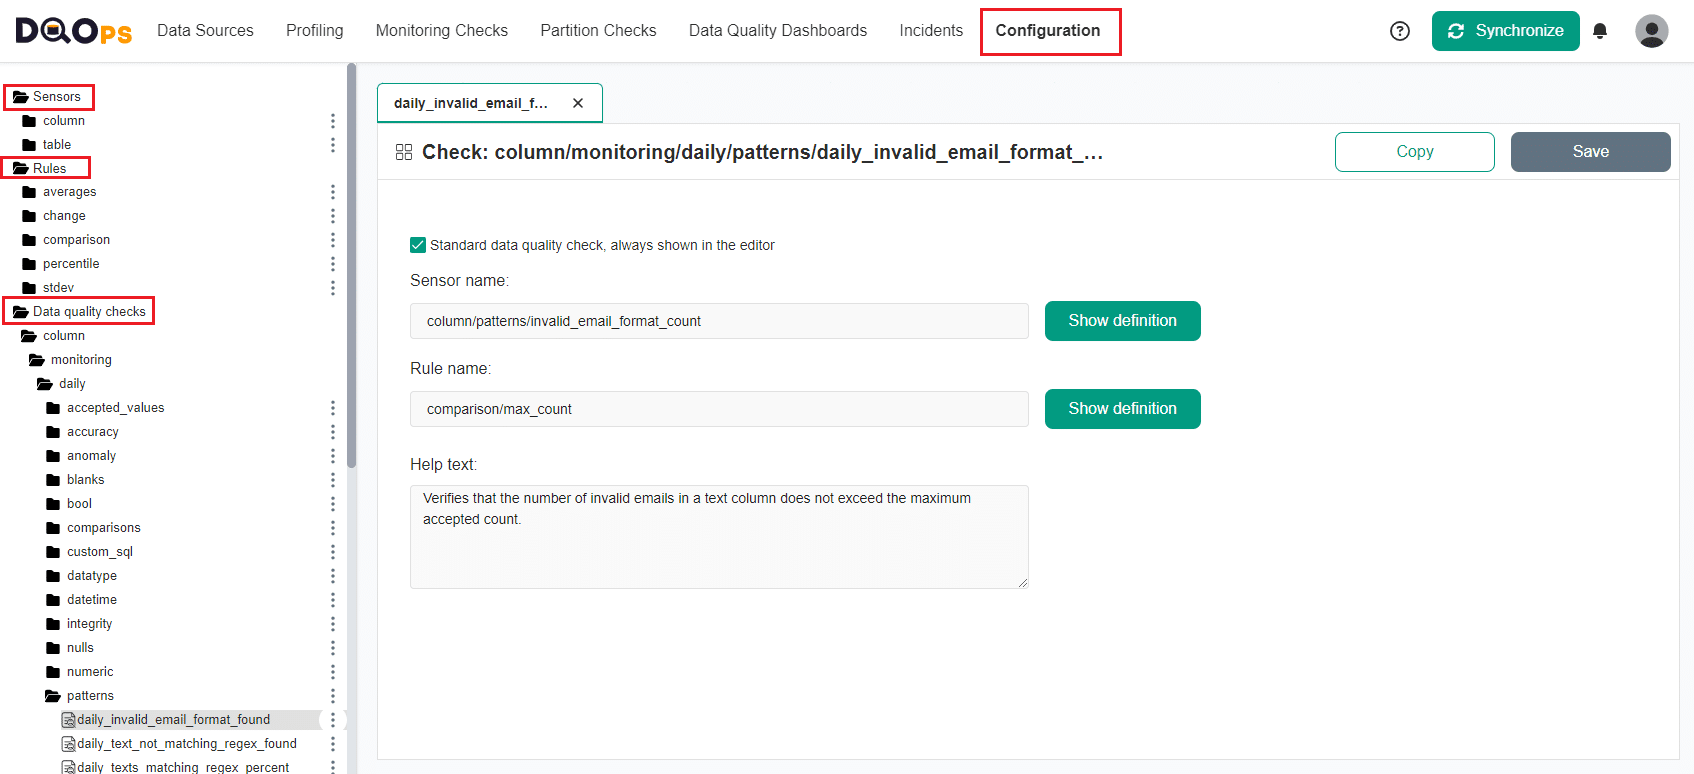
To create your own customized checks, sensors, and rules using the user interface, navigate to the Configuration section.
On the tree view on the left, you will see a complete list of all checks, sensors, and rules that are available in DQOps. Clicking on any of these elements will open up a check editor in the main workspace.
Navigating tabs
When you select an item from the tree view, it will open in a new tab within the main workspace. You can easily switch between open tabs by clicking on them, and close tabs that are no longer needed. Please note that there is a limit of seven tabs that can be opened at once. If you try to open an eighth tab, the first one you open will be automatically closed to maintain the limit.
The below example shows a check editor of the daily_invalid_email_format_found check.
Create a custom sensor
To create a custom sensor, you can copy an existing sensor and use it as a template (recommended) or create a new sensor.
To copy an existing sensor:
- On the Configuration section, select a sensor from the tree view on the left, that you will use as a template.
- Make a copy of the sensor, by clicking on the Copy button.
- Enter a new name and modify the sensor configuration.
- Click the Save button to save the changes.
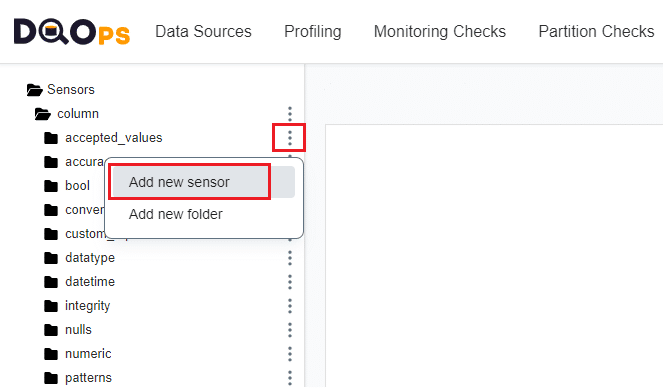
To create a new sensor:
- Click on the three dots icon next to the name of the sensor category, and click on the Add new sensor option.
- Enter a new name and modify the sensor configuration.
- Click the Save button to save the changes.
In our example, we want to modify the invalid-email-count sensor, which is located in the sensors/column/patterns folder.
On the sensor configuration screen, you can see a tab with the Sensor definition when you can choose to set that a check requires
event and ingestion timestamps columns, set the default value when the table is empty and modify the sensor fields and parameters.

There are also tabs for different data sources which allows you to see and modify the source-specific templated Jinja2 SQL queries
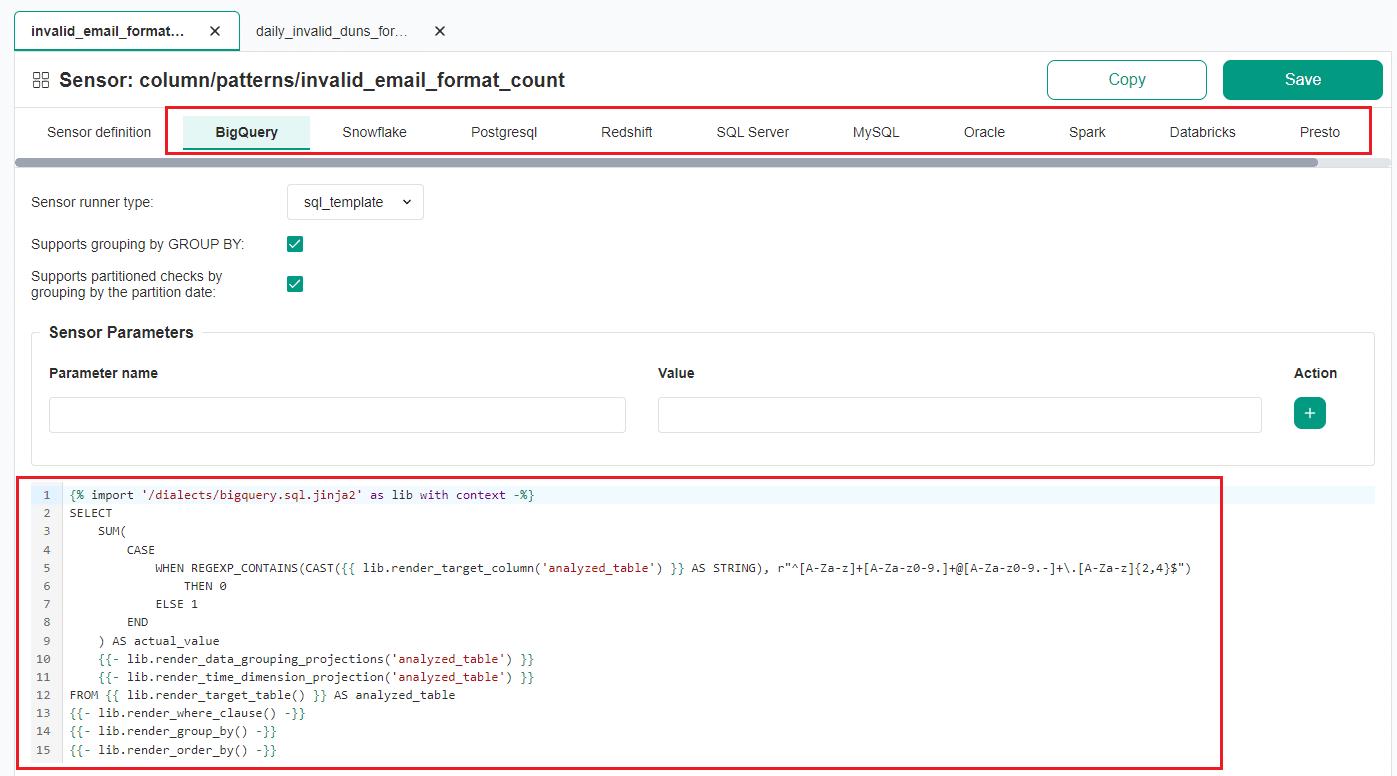
As an example, we can modify the query for the BigQuery data source to verify the number the DUNS number. We will name it invalid_duns_format_count.
The sensor will calculate the number of rows with an invalid DUNS number. To do this, we need to change the fragment of templated
Jinja2 SQL query with a regular expression that recognizes email to a regex that recognizes nine-digit number ^[0-9]{9}$.
Below is an example of Jinja2 SQL query before and after modification.
{% import '/dialects/bigquery.sql.jinja2' as lib with context -%}
SELECT
    SUM(
        CASE
            WHEN REGEXP_CONTAINS(CAST({{ lib.render_target_column('analyzed_table') }} AS STRING), r"^[A-Za-z]+[A-Za-z0-9.]+@[A-Za-z0-9.-]+\.[A-Za-z]{2,4}$")
                THEN 0
            ELSE 1
        END
    ) AS actual_value
    {{- lib.render_data_grouping_projections('analyzed_table') }}
    {{- lib.render_time_dimension_projection('analyzed_table') }}
FROM {{ lib.render_target_table() }} AS analyzed_table
{{- lib.render_where_clause() -}}
{{- lib.render_group_by() -}}
{{- lib.render_order_by() -}}
{% import '/dialects/bigquery.sql.jinja2' as lib with context -%}
SELECT
    SUM(
        CASE
            WHEN REGEXP_CONTAINS(CAST({{ lib.render_target_column('analyzed_table') }} AS STRING), r"^[0-9]{9}$")
                THEN 0
            ELSE 1
        END
    ) AS actual_value
    {{- lib.render_data_grouping_projections('analyzed_table') }}
    {{- lib.render_time_dimension_projection('analyzed_table') }}
FROM {{ lib.render_target_table() }} AS analyzed_table
{{- lib.render_where_clause() -}}
{{- lib.render_group_by() -}}
{{- lib.render_order_by() -}}
Create a custom rule
To create a custom rule, you can copy an existing rule and use it as a template (recommended) or create a new rule.
To copy an existing rule:
- On the Configuration section, select a rule from the tree view on the left, that you will use as a template.
- Make a copy of the rule, by clicking on the Copy button.
- Enter a new name and modify the rule configuration.
- Click the Save button to save the changes.
To create a new rule:
- Click on the three dots icon next to the name of the rule category, and click on the Add new rule option.
- Enter a new name and modify the rule configuration.
- Click the Save button to save the changes.

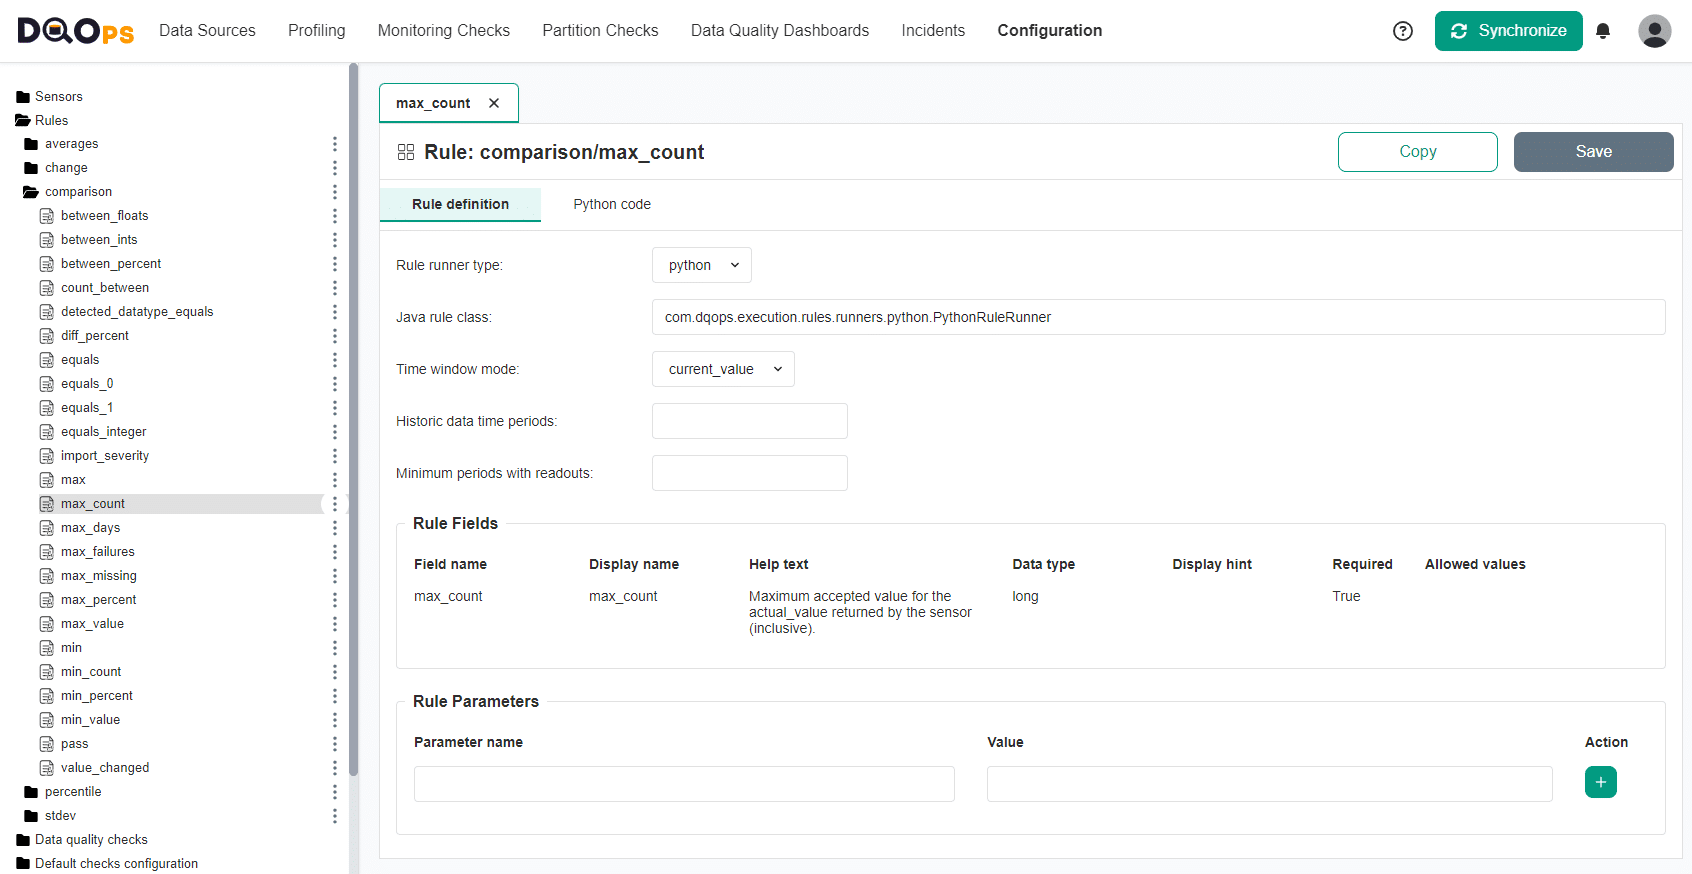
The custom rule screen contains two tabs Rule definition and Python code which can be modified and allows customization of both the existing and new rules.
Create a custom check
To create a custom check, you can copy an existing check and use it as a template or create a new check.
To copy an existing check:
- On the Configuration section, select a check from the tree view on the left, that you will use as a template.
- Click on the Copy button.
- Enter a new check name.
- Modify the check configuration by selecting sensor and rule from the dropdown menu.
- Click on the Save button, to save the changes.
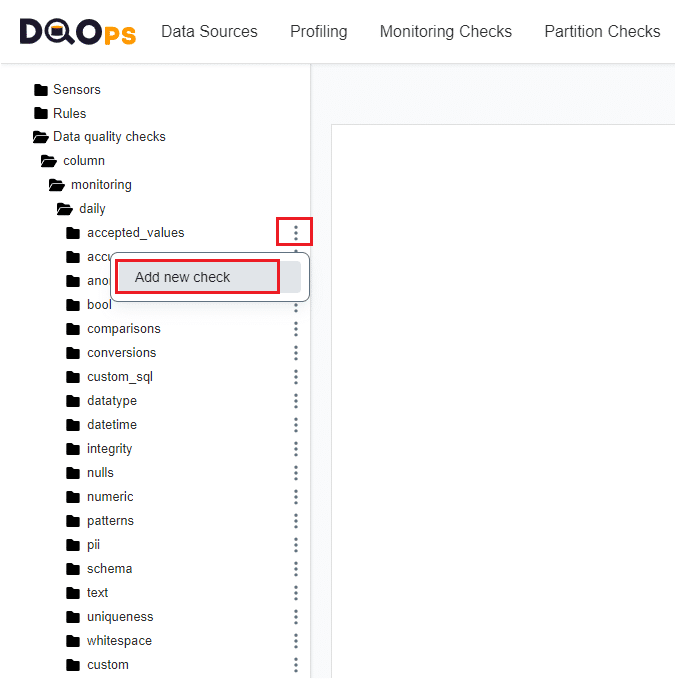
To create a new check:
- Click on the three dots icon next to the name of the existing check category or in the
customcategory, and click on the Add new check option. - Enter a new name and modify the check configuration by selecting sensor and rule from the dropdown menu.
- Click the Save button to save the changes.
Check modification
You cannot modify the configuration of the built-in checks, but you can modify the check that has been added. The checks that have been added are shown on the tree view in bold.
As an example, we will show how to modify the daily_invalid_email_format_found check, which is located in the column/monitoring/daily/patterns/ folder.
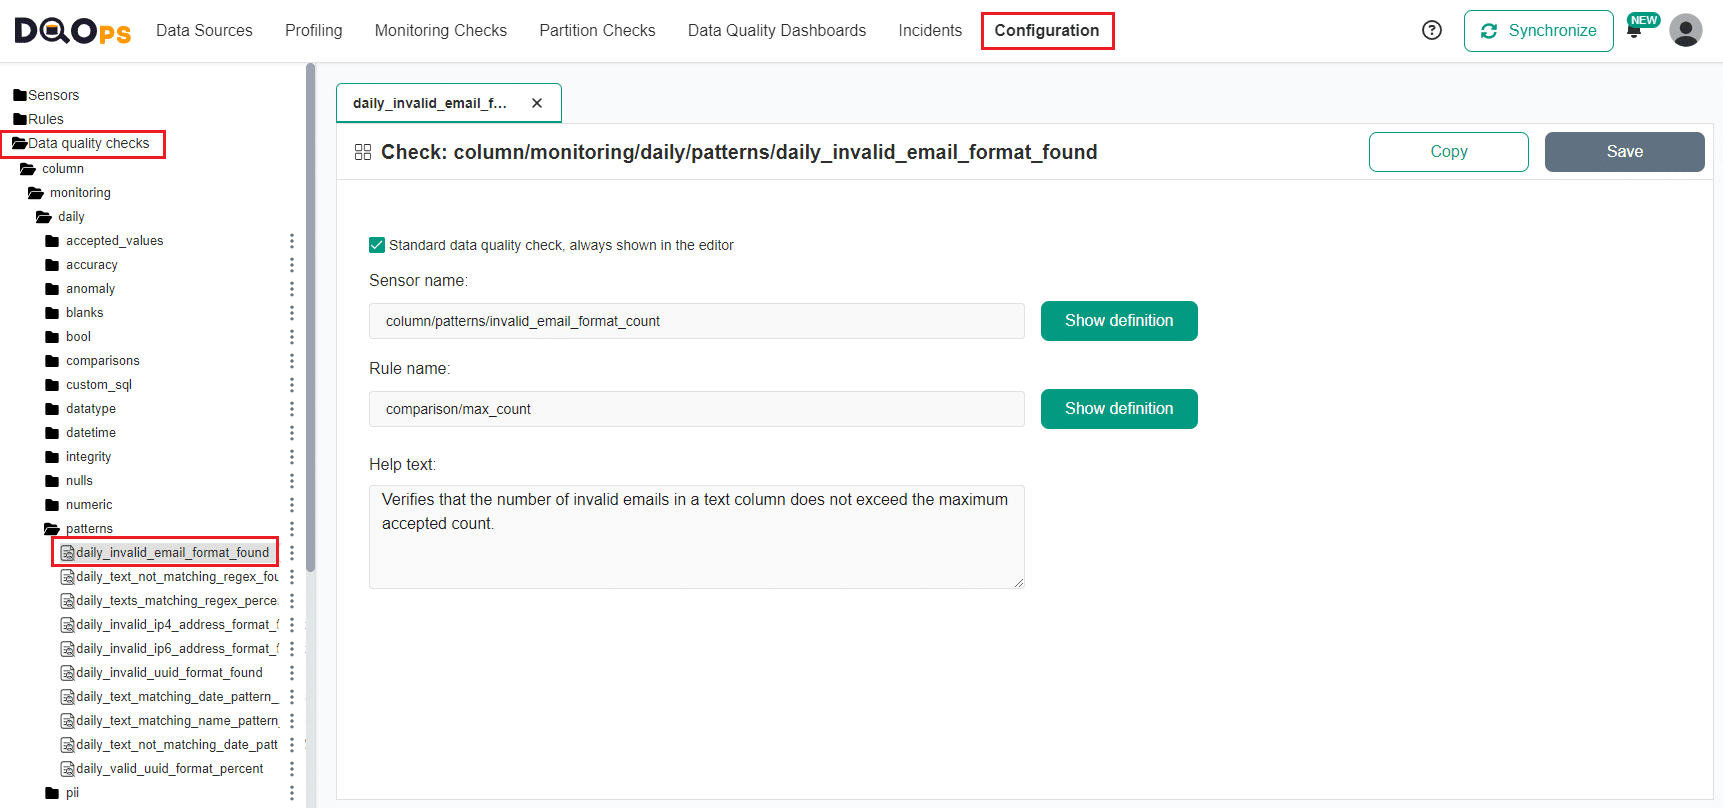
On the main workspace of the check editor, you can see the names of the sensor and rule associated with this check. Clicking on the Show definition button will link you to the details of the sensor or rule used in the checks.
There is also a checkbox indicating whether the check is categorized to the standard data quality checks and is always shown in the check editor.
In our example, we copied the daily_invalid_email_format_found check,
and named it daily_invalid_duns_format_found).
The copied check will appear in the tree view in the same folder as the check used as a template. The checks that have been added are shown on the tree view in bold.
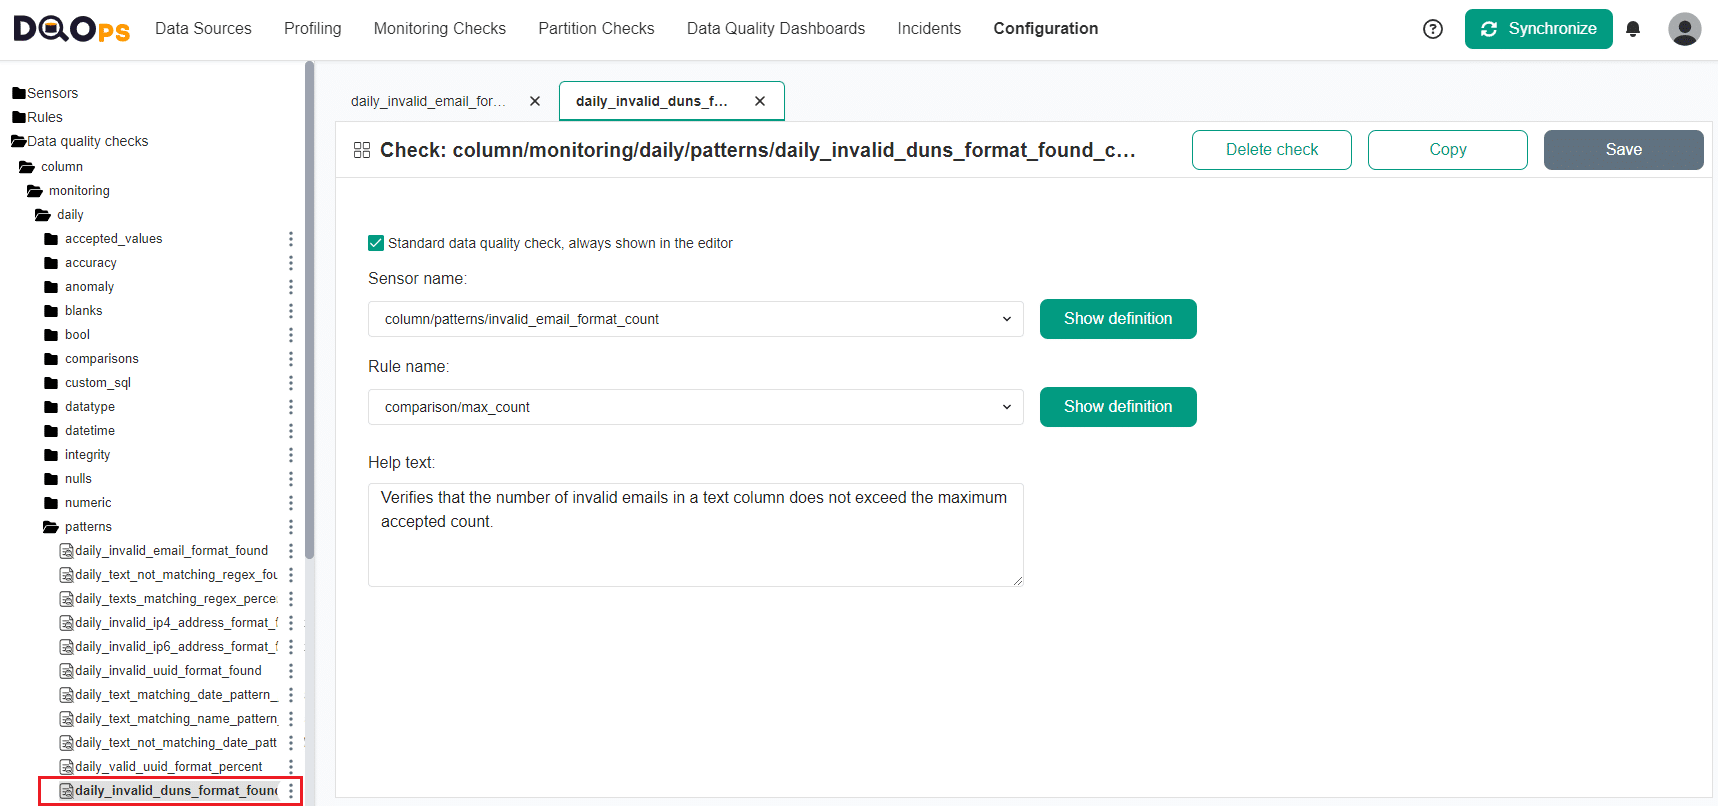
To change the sensor that is assigned to a check, simply select the sensor of choice from the dropdown menu and Save the changes by clicking on the Save button.
We will assign to this check a newly created sensor invalid_duns_format_count that calculates the number of rows with invalid DUNS number.

If you want to change the rule, simply, choose a new rule from the dropdown menu.
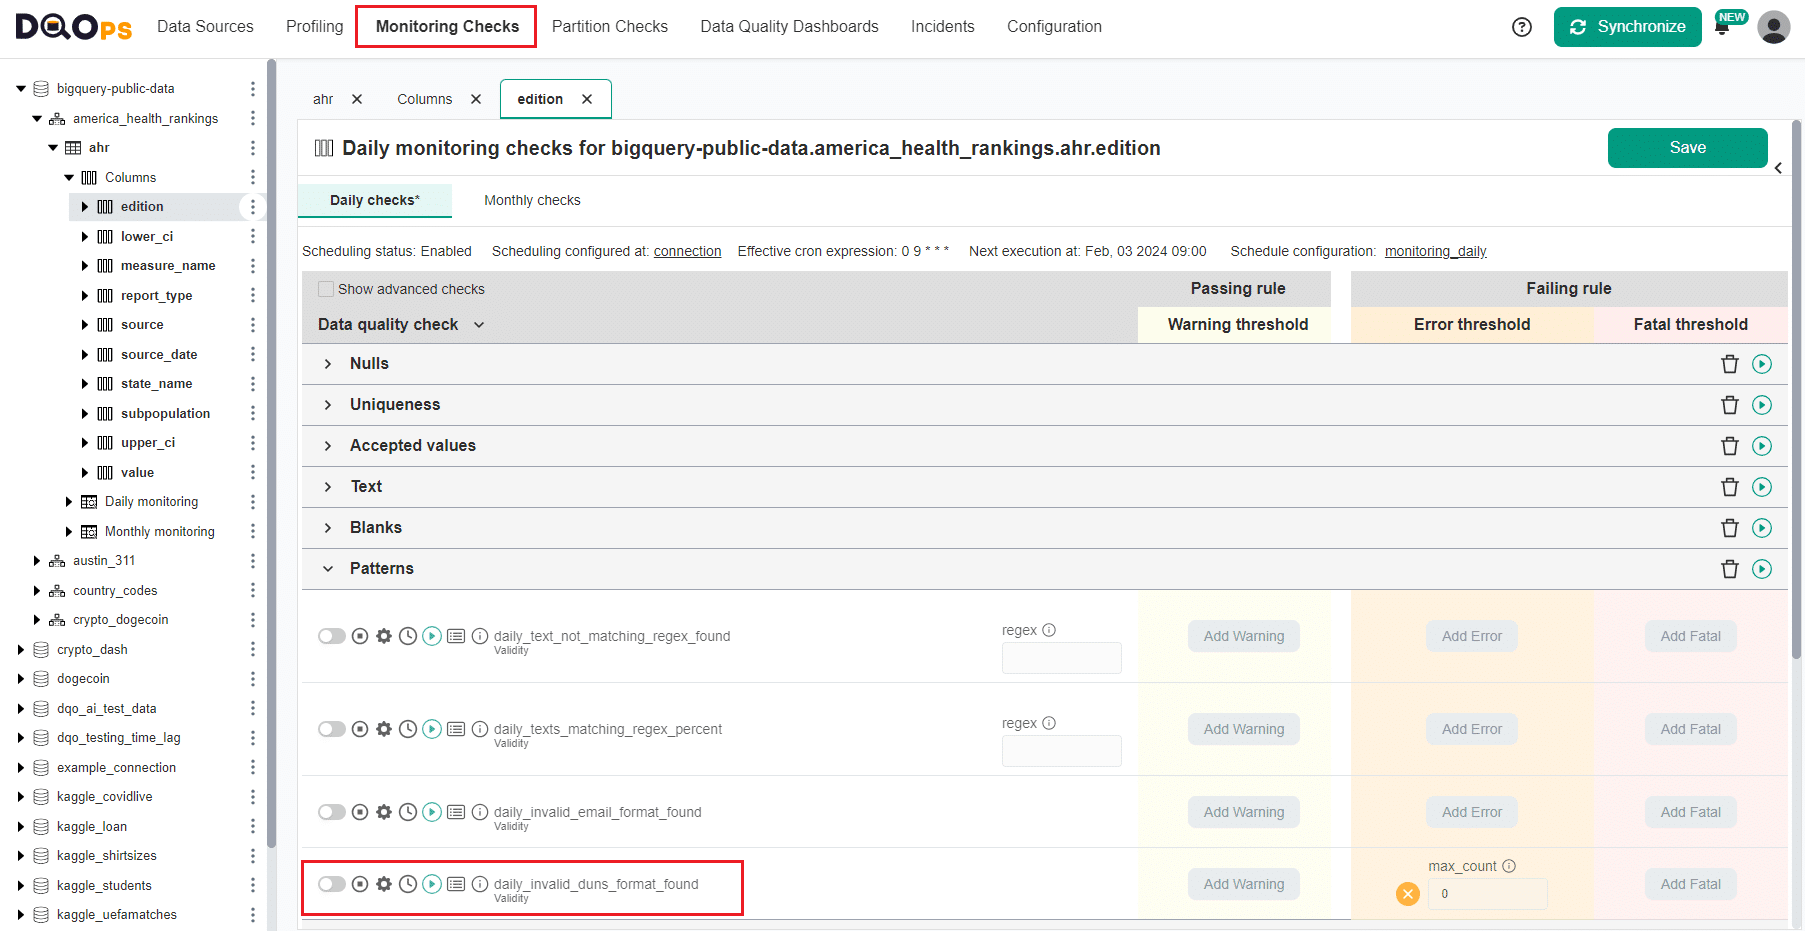
After saving changes, the new check is now visible on the Check editor and can be run.
Create an anomaly detection custom check
In DQOps, we can detect two types of anomalies in numeric columns using built-in checks. We can detect outliers, which are new minimum and maximum values, or we can detect if the typical values such as mean (average), median, or sum have changed. For more information on how to detect anomalies, follow the link.
Besides the build-in checks for detecting anomalies, we can turn any check into anomaly detection check, by copying it and assigning an anomaly rule:
- anomaly differencing percentile moving average
- anomaly differencing percentile moving average 30 days
- anomaly stationary percentile moving average
- anomaly stationary percentile moving average 30 days
For example, we can create a check detecting anomalies in percentage of blank and whitespace values, such as 'None', 'n/a', '', by
changing the rule of the daily_whitespace_text_percent from comparison/max_percent
to percentile/anomaly_stationary_percentile_moving_average.
Storing definitions of custom sensors
All the added custom sensors are stored in the DQOps user home folder
The configuration of custom and overwritten data quality sensors are stored in the sensors folder. The configuration for each data source is stored in two files:
- sensors//
.dqoprovidersensor.yaml specification file with additional configuration for that data source type. - Jinja2 file stored in the sensors//
.sql.jinja2 file.
Storing definitions of custom rules
All the added custom rules are stored in the DQOps user home folder
The definition of custom and overwritten data quality rules are stored in the rules folder.
Storing definitions of custom checks
The definitions of custom checks are saved in YAML files (*.dqocheck.yaml).,
just like any other check. The YAML files are stored in the checks folder in the DQOps user home folder.
The custom check configuration in the YAML files differs based on whether you have configured a check inside an existing check category or in the
special custom folder.
For instance, here is an example of a YAML file that contains a custom column check called daily_invalid_duns_format_found, created within an existing patterns check category.
# yaml-language-server: $schema=https://cloud.dqops.com/dqo-yaml-schema/TableYaml-schema.json
apiVersion: dqo/v1
kind: table
spec:
  incremental_time_window:
    daily_partitioning_recent_days: 7
    monthly_partitioning_recent_months: 1
  profiling_checks:
    volume:
      profile_row_count:
        error:
          min_count: 0
  columns:
    alpha_2_code:
      type_snapshot:
        column_type: STRING
        nullable: true
      monitoring_checks:
        daily:
          patterns:
            custom_checks:
              daily_invalid_duns_format_found:
                error:
                  max_count: 0
Below is an example of a YAML with a custom column check daily_invalid_duns_format_found created within a special custom check category
# yaml-language-server: $schema=https://cloud.dqops.com/dqo-yaml-schema/TableYaml-schema.json
apiVersion: dqo/v1
kind: table
spec:
  incremental_time_window:
    daily_partitioning_recent_days: 7
    monthly_partitioning_recent_months: 1
  profiling_checks:
    volume:
      profile_row_count:
        error:
          min_count: 0
  columns:
    alpha_2_code:
      type_snapshot:
        column_type: STRING
        nullable: true
      monitoring_checks:
        daily:
          custom:
            daily_invalid_duns_format_found:
              error:
                max_count: 0
What's more
- Look at the architecture diagrams showing how DQOps runs data quality checks to understand how DQOps uses all its configuration files.
- Learn how the data quality results are stored as Parquet files in the .data folder.
- DQOps allows you to keep track of the issues that arise during data quality monitoring and send alert notifications directly to Slack. Learn more about incidents and Slack notifications.