Last updated: April 09, 2024
Create and run table comparisons
Read this manual to understand how to compare tables between data sources using DQOps. Table comparison (reconciliation) enables detection of data accuracy issues.
Overview
Table comparison enables you to identify differences between two tables. It is useful when you want to compare datasets and validate successful data replication or migration. You can compare tables between any supported data sources.
Types of comparison checks
Using Table comparison you can monitor tables using the following comparison checks:
Table-level checks:
- row count match compares the row count of the current (parent) table to the row count of the reference table.
- column count match compares the column count of the current (parent) table to the column count of the reference table.
Column-level checks:
- sum match compares the sum of the values in the tested column to the sum of values in a reference column from the reference table.
- min match compares the minimum value in the tested column to the minimum value in a reference column from the reference table.
- max match compares the maximum value in the tested column to the maximum value in a reference column from the reference table.
- mean match compares the mean (average) of the values in the tested column to the mean (average) of values in a reference column from the reference table.
- not null count match compares the count of not null values in the tested column to the count of not null values in a reference column from the reference table.
- null count match compares the count of null values in the tested column to the count of null values in a reference column from the reference table.
Create a new table comparison
Table comparisons can be categorized into three types: profiling, monitoring, and partition. You can read more about these types of checks in the DQOps concept section.
Navigate to table comparison screen
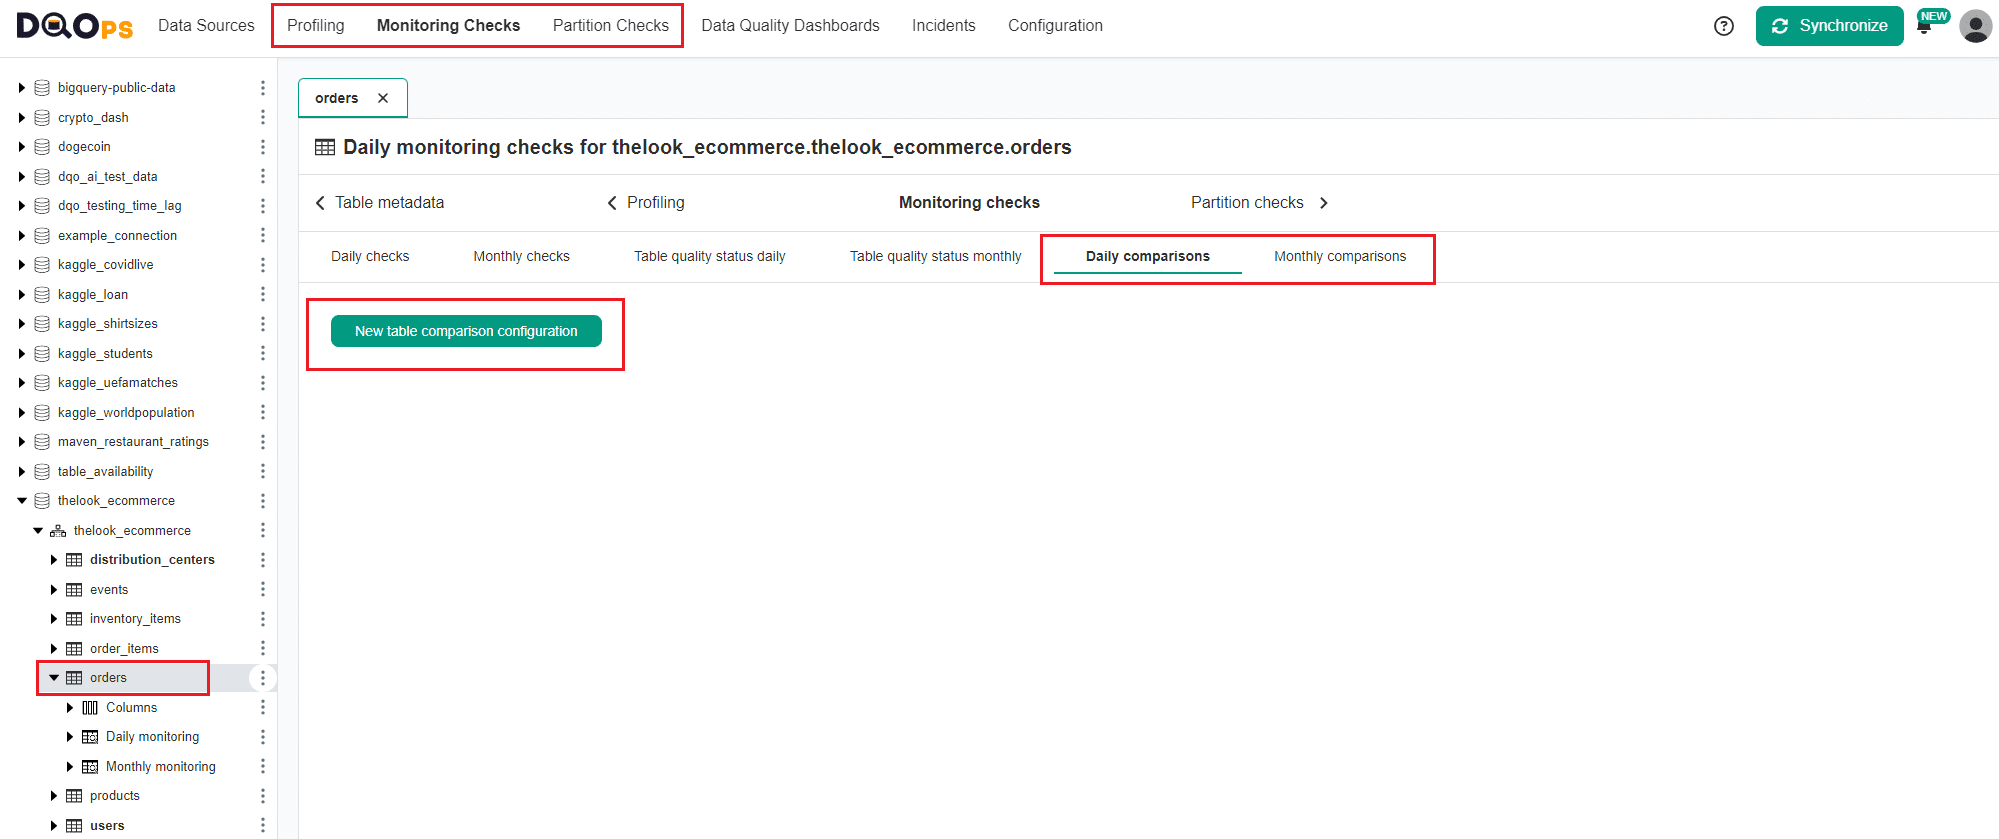
To navigate to table comparison screen, follow these steps:
-
Select the Profiling, Monitoring checks, or Partition checks section and select the table of interest from the tree view on the left. This will be your source table.
-
Select Table Comparisons/Daily Comparisons/Monthly Comparisons tab
- Click the New table comparison configuration button.
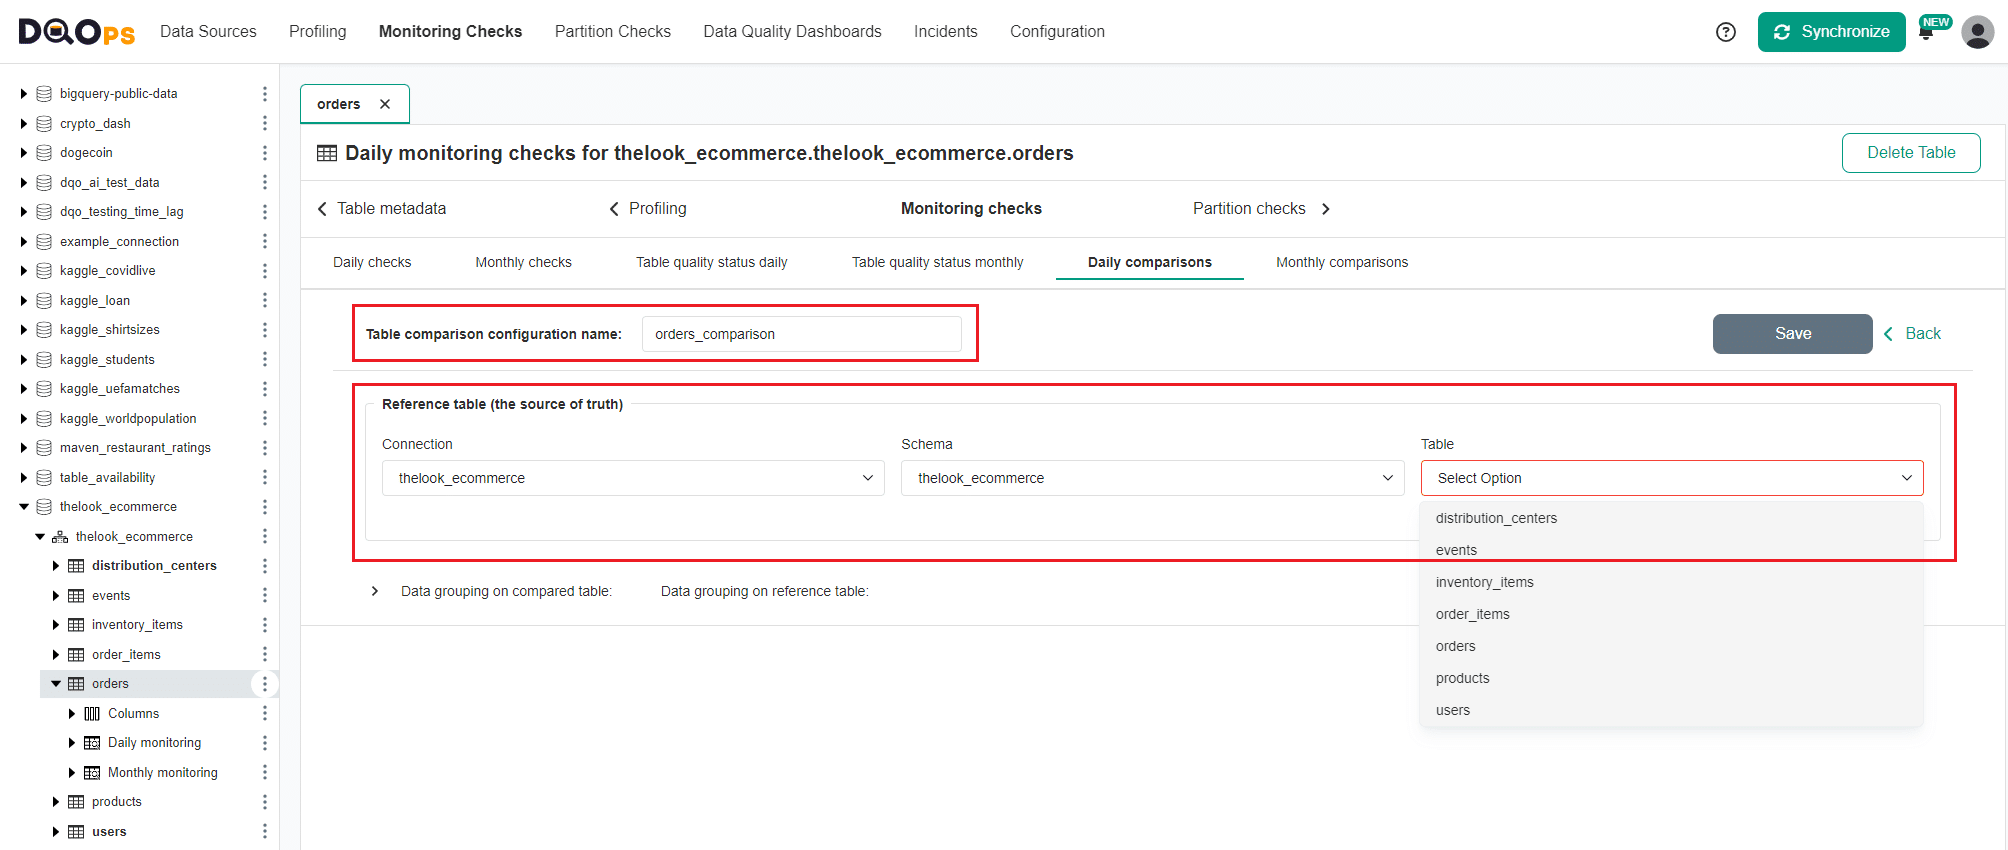
Select the reference table
On the table comparison screen, enter a unique name for your comparison and select the reference table by filtering the connection, schema, and table name from the dropdown menu.
Optional data grouping in comparisons
You can group your data before comparison by using a discriminator column containing data such as location, business units, vendor, etc.
If you want to use data grouping, select columns on compared (source) and reference tables. DQOps compares up to 1000 distinct data group rows by default.
You can modify this limit by changing the --dqo.sensors.limit.sensor-readout-limit parameter.
Learn more about data groupings.

Save a new table comparison
To save a new table comparison, simply click the Save button located in the upper right corner.
This will show a comparison screen where you can match the reference columns to the source columns. DQOps will automatically map the columns between the tables based on the column names, but you can make adjustments if necessary.
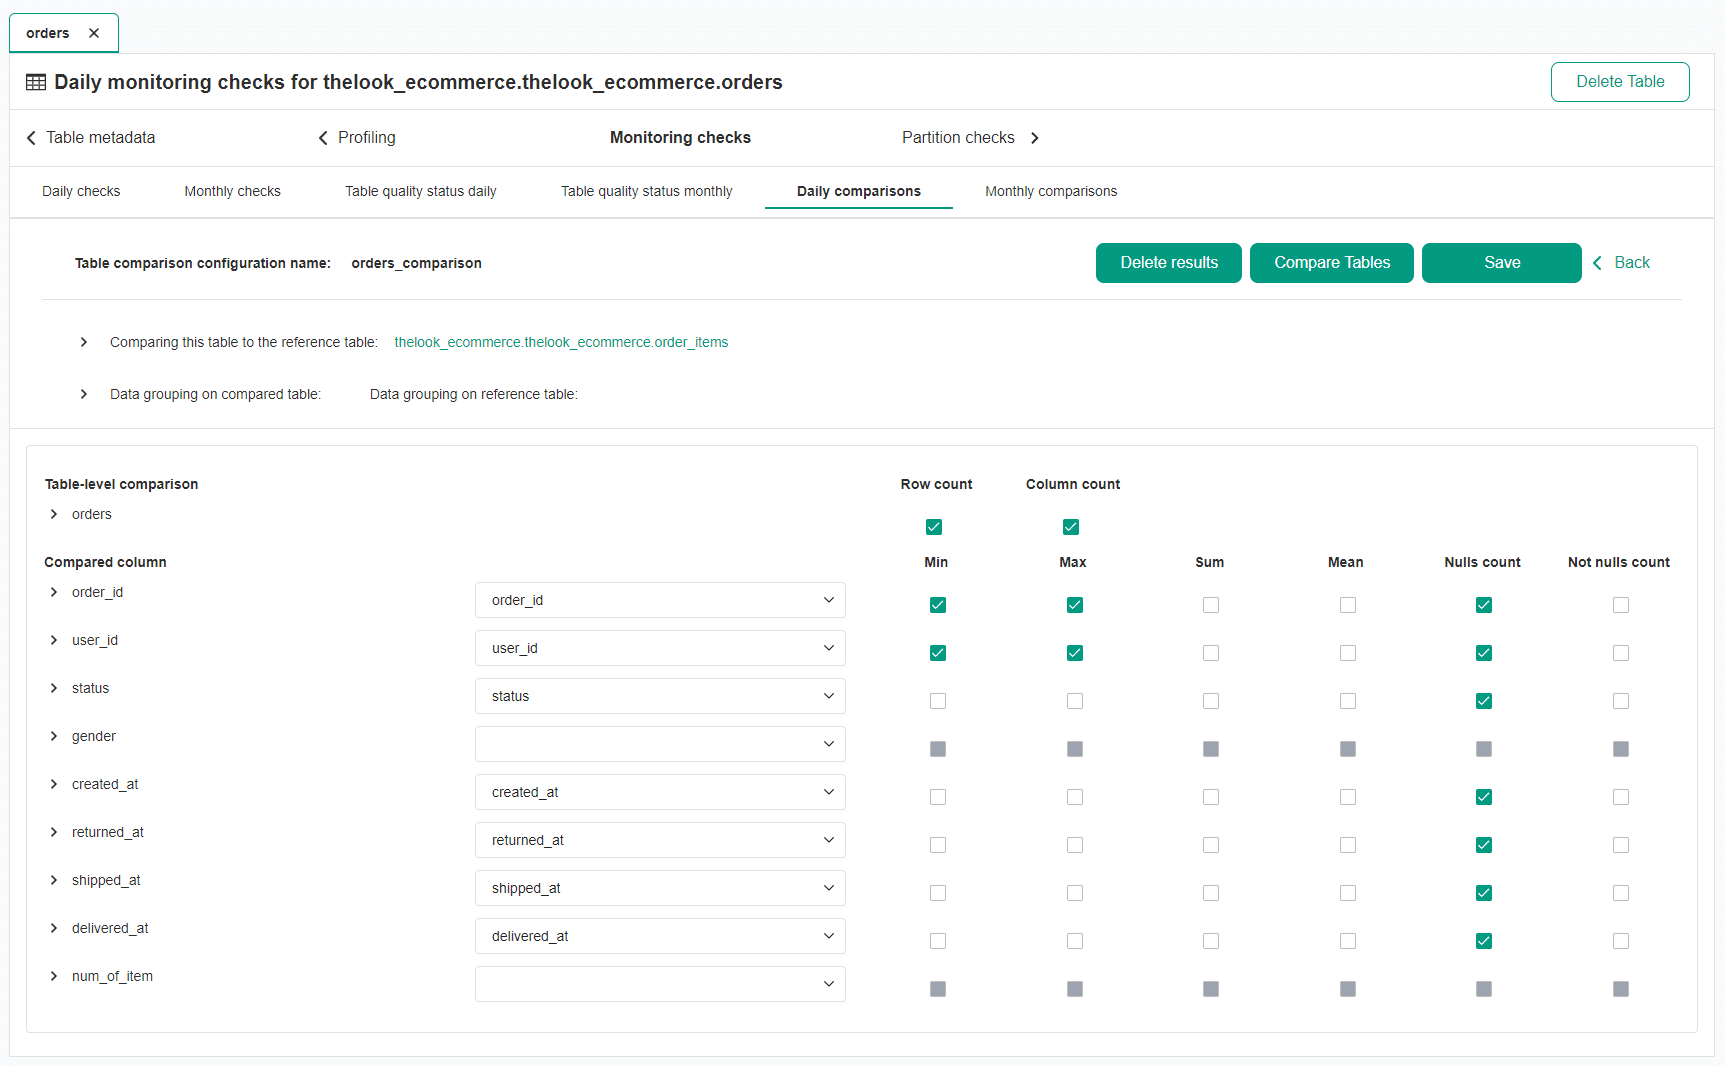
Run table comparison
The right part of the comparison screen has a list of comparison checks which you can run. To activate the comparison checks you want to run, simply click on the checkboxes.
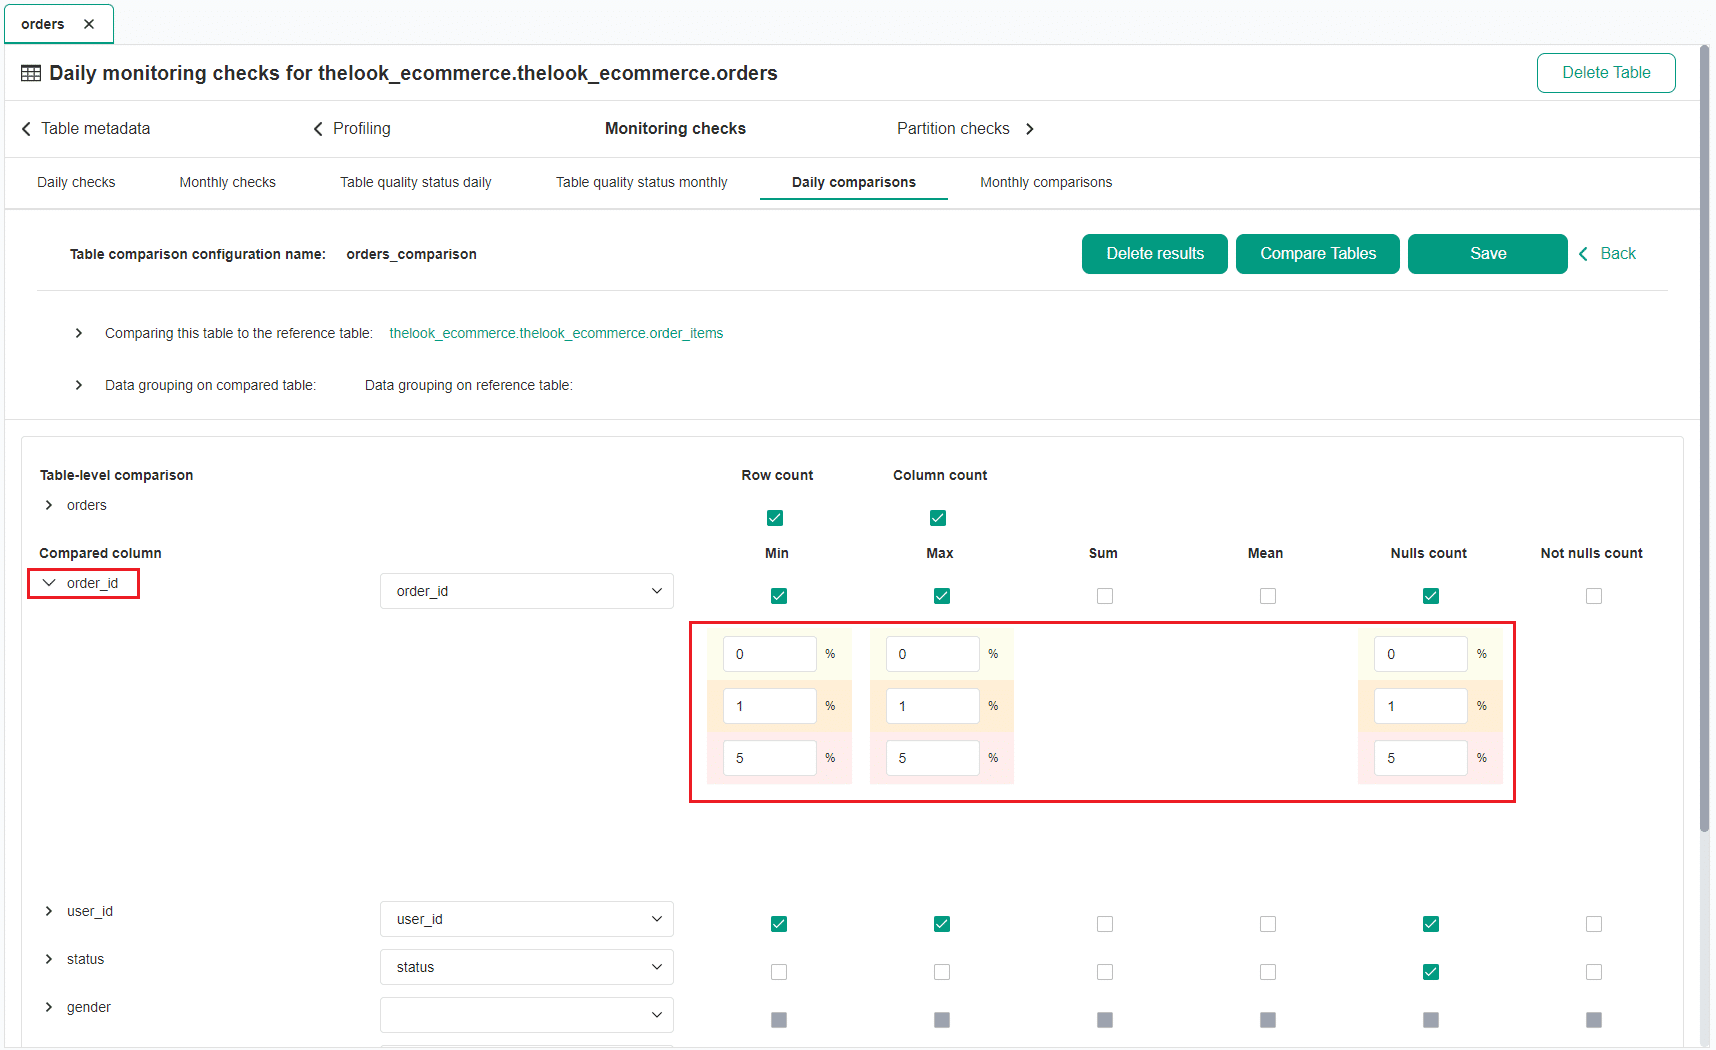
Once you have activated the checks, you can set the severity level for each one. You can choose from three levels: warning, error, and fatal. Learn more about the severity levels.
When you create a new table comparison a new category of checks named Comparisons/[name of the comparison] is also created on the Check editor with a list of table and column checks. On the Editor screen you can activate and deactivate comparison checks, set severity levels, run checks and view the results.

After making all the necessary adjustments, click the Save button to save the changes.
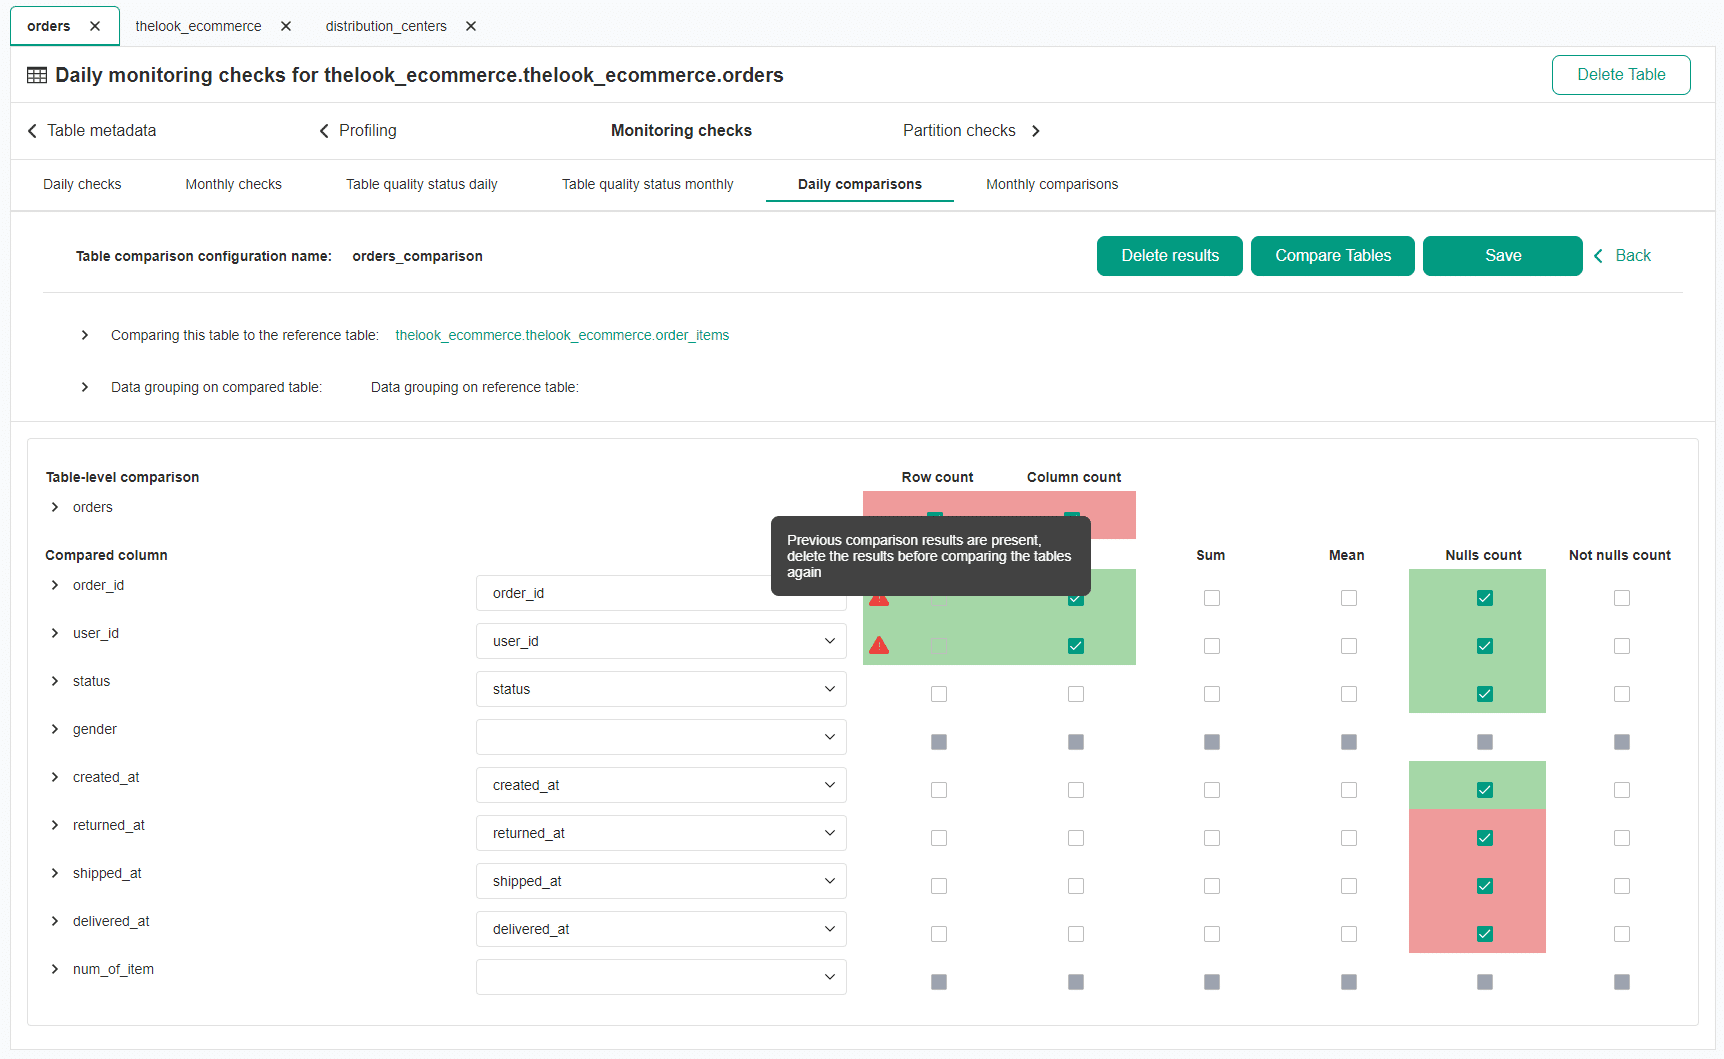
Once all the required elements have been set, run the comparison between two tables by clicking the Compare Tables button. After completion of the job, the checkbox will be highlighted with the color of the result: green for valid, yellow for warning, orange for error and red for fatal.

View detailed results of table comparison
By expanding the rows, you can view the more detailed results. Additionally, if you set the grouping columns, you will be able to view a list of mismatches in the data groupings.

In a situation when you see the results for a table comparison checks that have been collected earlier, you can delete the old results by clicking the Delete results button.
Deleting table comparison
To remove an entire table comparison configuration, go to the list of table comparisons and click the Delete button.

Next steps
- Read the concept of table comparison (data reconciliation) data quality checks supported by DQOps.
- You haven't installed DQOps yet? Check the detailed guide on how to install DQOps using pip or run DQOps as a Docker container.
- DQOps provide you with summary statistics about your table and column. This information can be valuable in deciding which data quality checks and threshold levels should be set to monitor data quality. For more details about Basic data statistics, click here.
- DQOps allows you to keep track of the issues that arise during data quality monitoring and send alert notifications directly to Slack. Learn more about incidents and Slack notifications.