Last updated: April 09, 2024
Basic data statistics
Read this manual to learn how to collect basic statistics about data sources during the data profiling stage, before activating advanced profiling checks.
Overview
DQOps provides you with summary information about your tables and columns through basic statistics. This information is valuable in deciding which data quality checks and threshold levels should be set to monitor data quality.
You have the option to collect statistics either on the table or column summary view or on an individual column level.
Collect and view statistics
Navigate to the Basic data statistics section
To navigate to the Basic data statistics section:
-
Click on to the Profiling section.
-
Select the desired data source from the tree view on the left.
-
Choose a table or column for which you wish to collect statistics. The Basic data statistics tab is the default selection for this section.

Collect statistics
To collect statistics for the entire table, click the Collect statistics button in the upper right-hand corner.
You can also select the check button in front of the column name to choose the columns for which you want to run statistics.
To collect statistics for a single column, click the bar chart icon located in the Action column.

Collect statistics from a tree view
You can also run statistics for entire connection, schema, table, or column from the tree view on the left-hand side of the screen. There are also additional parameters you can select.
To do so, click on the three-dot icon and select the Collect statistics option.

A dialog box will appear where you can modify different options such as connection, schema and table name, and column name. There are also additional parameters when you can narrow the selection to the collector category, collector name, sensor name, target (table or column), labels, or tags.
You can filter schemas, tables and columns using wildcards (*). For example, prod_* will return all tables starting with "prod_".
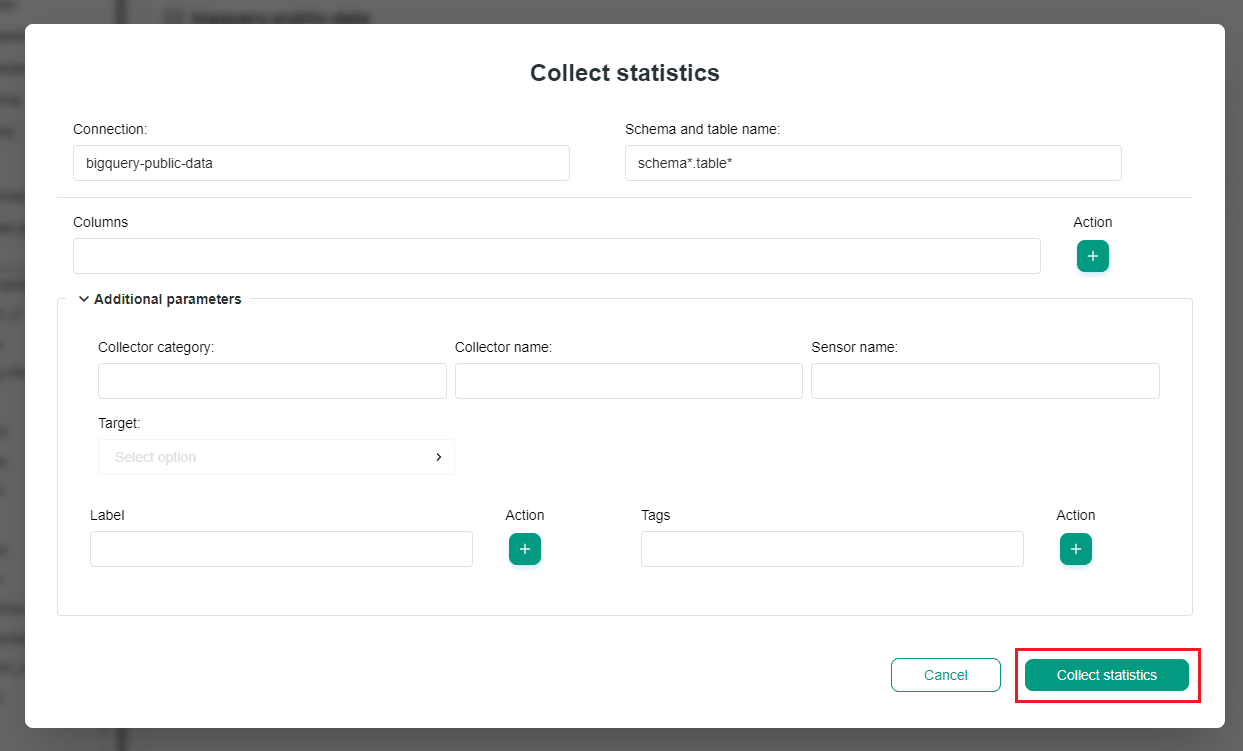
After selecting options simply click the Collect statistics button.
View summary statistics
Upon completion of the statistics collection, the results will be displayed. You can filter the columns by simply clicking on the sorting icon next to any column header
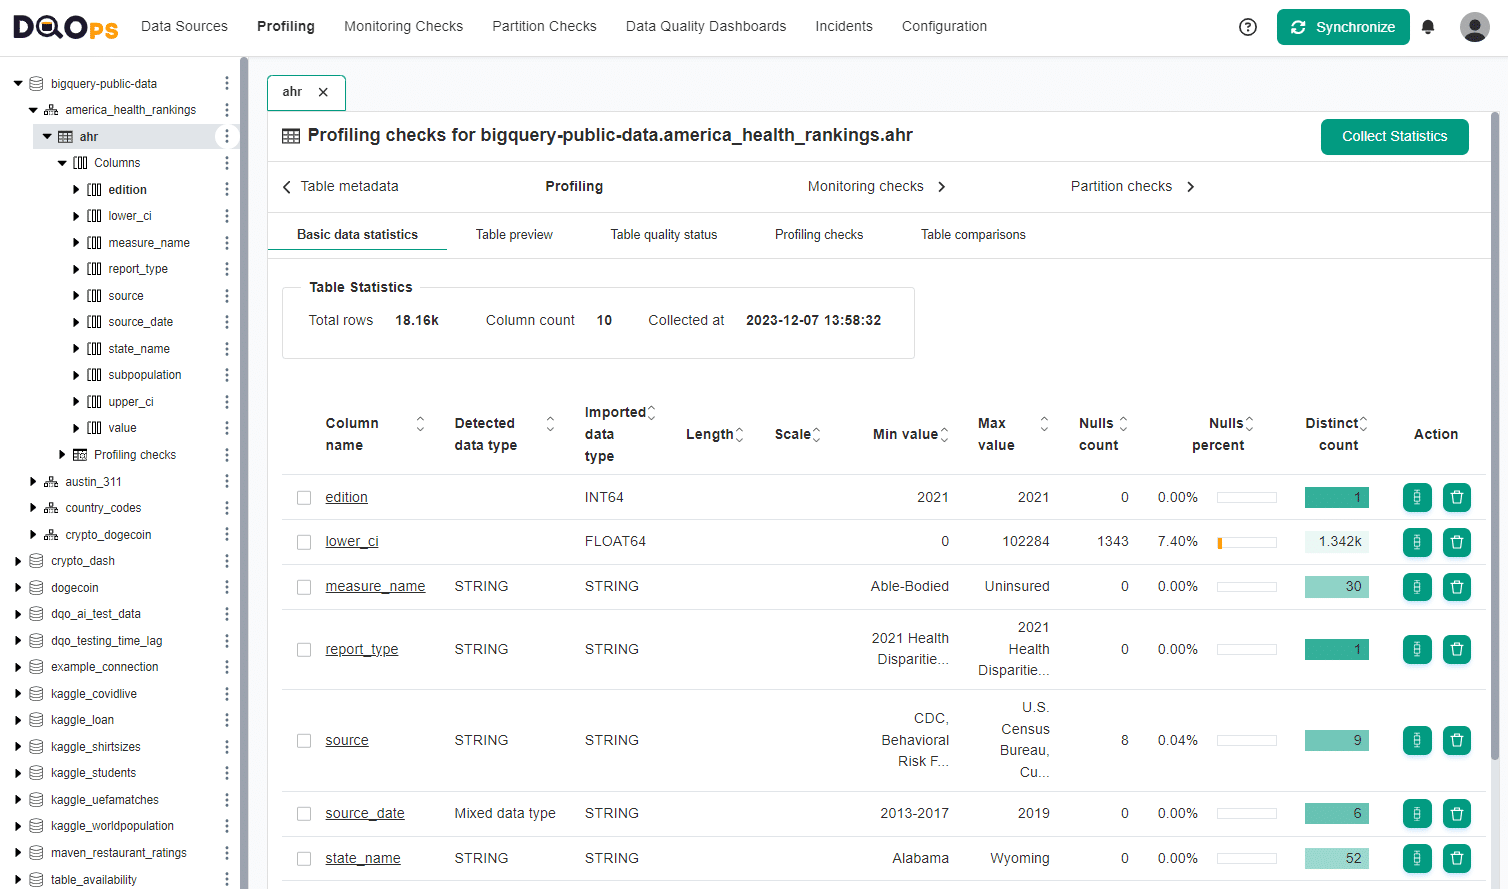
The table or column summary statistics include the following fields.
In the Table Statistics box:
- Total rows: The number of rows in the table (displayed only in table-level view).
- Column count: The number of columns.
- Collected at: The date and time when the statistics were collected.
In the summary table:
- Column name: The name of the column in the selected table. Clicking on the column name will lead you to the detailed statistics.
- Detected data type: The data type detected for STRING columns, which can be INTEGER, FLOAT, DATETIME, TIMESTAMP, BOOLEAN, STRING, or Mixed data types.
- Imported data type: The physical data type retrieved from the database metadata, specific to the data source.
- Length: The number of bytes used to store the number for numeric data types. For VARCHAR and CHAR, the length of a character string is the number of bytes.
- Scale: The number of digits to the right of the decimal point in a number.
- Min value: The smallest value in the column.
- Max value: The biggest value in the column.
- Null count: The number of null values in the column.
- Null percent: The percentage of null values in the column.
- Distinct count: The number of distinct values in the column. The color of the field indicates the relative number of distinct values and helps identify low-cardinality columns.
- Action: Buttons that allow you to collect statistics for the individual column or delete the column.
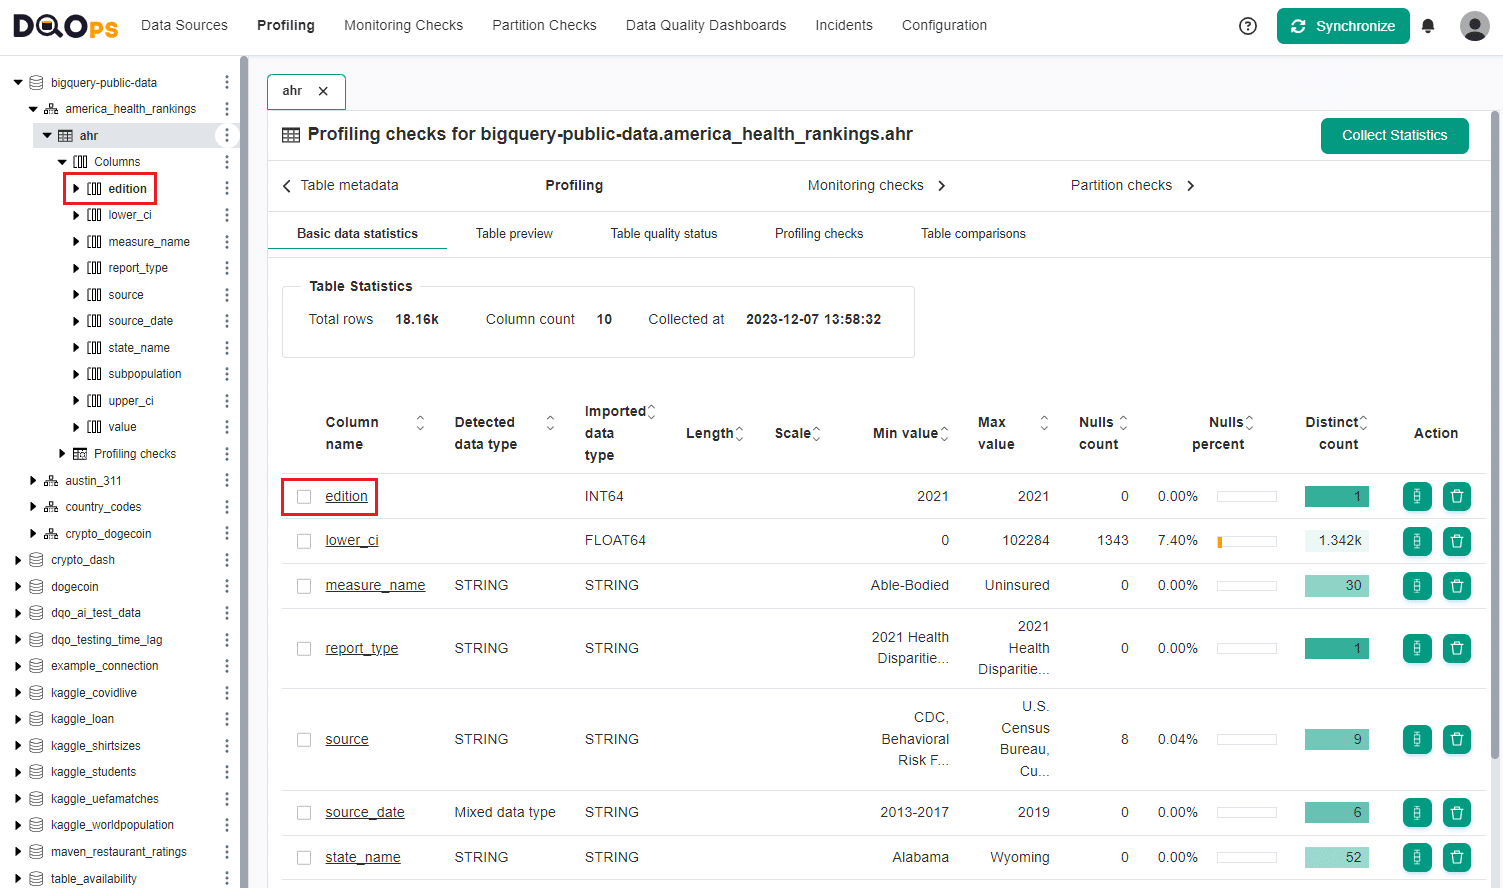
View detailed statistics
To view detailed statistics, click on the name of the column or navigate to the single column on the tree view.
At the level of a single column, statistics provide more information than in the summary statistics and are grouped into:
- Nulls: Displays the nulls and not-nulls count and percentage.
- Uniqueness: Shows distinct and duplicate count and percentage.
- Range: Shows minimum, maximum, median, and sum.
- String length: For string data types, shows the minimum, maximum and mean length of the string values.
- Top most common values: Shows the top most popular values in the column.
Below there is a sample view of statistics at the level of a single column. Note that the results displayed may vary depending on the data type.

What's next
- Check the detailed manual of how to run data quality checks using the check editor.
- Now you might want to check how to delete data quality results including basic data statistics results.