Last updated: April 10, 2024
List of data quality use cases and examples
Check various examples demonstrating how the DQOps platform can detect data quality issues, and help you evaluate results on data quality dashboards.
List of data quality use cases
Here is a comprehensive list of examples with links to the relevant documentation section with detailed descriptions. These examples use openly available datasets from Google Cloud.
Data accuracy
| Name of the example | Description | Link to the dataset description |
|---|---|---|
| Integrity check between columns in different tables | This example shows how to check the referential integrity of a column against a column in another table using lookup_key_found_percent check. | Link |
Data availability
| Name of the example | Description | Link to the dataset description |
|---|---|---|
| Detect table availability issues | This example shows how to verify that a query can be executed on a table and that the server does not return errors using table_availability check. | Link |
Data completeness
| Name of the example | Description | Link to the dataset description |
|---|---|---|
| Detect incomplete columns | This example shows how to incomplete columns that have too many null values using the nulls_count check. | Link |
| Detect empty or incomplete tables | This example shows how to find empty or too small tables using the row_count check. | Link |
Data consistency
| Name of the example | Description | Link to the dataset description |
|---|---|---|
| Percentage of rows having only accepted values | This example shows how to verify that a text column contains only accepted values using the text_found_in_set_percent check. | Link |
Data reasonability
| Name of the example | Description | Link to the dataset description |
|---|---|---|
| Percentage of false boolean values | This example shows how to detect that the percentage of false values remains above a set threshold using false_percent check. | Link |
| Percentage of values in range | This example shows how to detect that the percentage of values within a set range in a column does not exceed a set threshold using integer_in_range_percent check. | Link |
| A text not exceeding a maximum length | This example shows how to check that the length of the text does not exceed the maximum value using text_max_length check. | Link |
Data uniqueness
| Name of the example | Description | Link to the dataset description |
|---|---|---|
| Percentage of duplicates | This example shows how to detect that the percentage of duplicate values in a column does not exceed the maximum accepted percentage using duplicate_percent check. | Link |
Data validity
| Name of the example | Description | Link to the dataset description |
|---|---|---|
| Detect invalid emails | This example shows how to detect that the number of invalid emails in a column does not exceed the maximum accepted count using invalid_email_format_found check. | DQOps dataset |
| Detect invalid IP4 address | This example shows how to detect that the number of invalid IP4 address in a column does not exceed a set threshold using invalid_ip4_address_format_found check. | DQOps dataset |
| Percentage of negative values | This example shows how to detect that the percentage of negative values in a column does not exceed a set threshold using negative_values_percent check. | Link |
| Percentage of rows passing SQL condition | This example shows how to detect that the percentage of passed sql condition in a column does not fall below a set threshold using sql_condition_passed_percent check. | Link |
| Percentage of texts matching a date pattern | This example shows how to detect that the percentage of texts matching the date format regex in a column does not exceed a set threshold using text_matching_date_pattern_percent check. | Link |
| Percentage of valid currency codes | This example shows how to detect that the percentage of valid currency codes in a column does not fall below a set threshold using text_valid_currency_code_percent check. | DQOps dataset |
| Percentage of valid latitude and longitude | This example shows how to detect that the percentage of valid latitude and longitude values remain above a set threshold using valid_latitude_percent and valid_longitude_percentchecks. | Link |
| Percentage of valid UUID | This example shows how to detect that the percentage of valid UUID values in a column does not fall below a set threshold using valid_uuid_format_percent check. | DQOps dataset |
| Percentage of rows containing USA zip codes | This example shows how to detect USA zip codes in text columns by measuring the percentage of rows containing a zip code using the contains_usa_zipcode_percent check. | Link |
Schema
| Name of the example | Description | Link to the dataset description |
|---|---|---|
| Detect table schema changes | This example shows how to detect schema changes on the table using several schema detection checks. | Link |
Data quality monitoring
| Name of the example | Description | Link to the dataset description |
|---|---|---|
| Detect empty tables | This example shows how to detect empty tables using the default data quality checks. | Link |
| Running checks with a scheduler | This example shows how to set different schedules on multiple checks. | Link |
Prerequisite
To use the examples you need:
- Installed DQOps.
- A BiqQuery service account with BigQuery > BigQuery Job User permission. You can create a free trial Google Cloud account here.
- A working Google Cloud CLI if you want to use Google Application Credentials authentication.
After installing Google Cloud CLI, log in to your GCP account, by running:
Location of the examples
Standard DQOps installation comes with a set of examples, which can
be found in the example/ directory. You can view a complete list of the examples with links to detailed explanation by
scrolling to the bottom of the page.
The example directory contains two configuration files: connection.dqoconnection.yaml, which stores the data source
configuration, and *.dqotable.yaml file, which stores the columns and tables metadata and checks configuration.
While it is not necessary to manually add the connection in our examples, you can find information on how to do it in the Working with DQOps section.
Start DQOps
To start the DQOps application with the example, follow the steps below.
-
Go to the directory where you installed DQOps and navigate, for example, to
examples/data-completeness/number-of-rows-in-the-table-bigquery.Run the command provided below in the terminal. This will install DQOps on your computer.
-
Create DQOps
DQOps user homefolder.After installation, you will be asked whether to initialize the DQOps user home folder in the default location. Type Y to create the folder. .
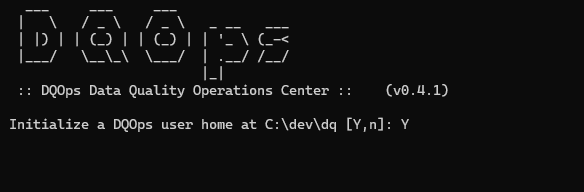
The DQOps user home folder locally stores data such as sensor and checkout readings, as well as data source configurations. You can learn more about data storage here.
-
Login to DQOps Cloud.
To use DQOps features, such as storing data quality definitions and results in the cloud or data quality dashboards, you must create a DQOps cloud account.
After creating the DQOps user home folder, you will be asked whether to log in to the DQOps cloud.

After typing Y, you will be redirected to https://cloud.dqops.com/registration, where you can create a new account, use Google single sign-on (SSO) or log in if you already have an account.
During the first registration, a unique identification code (API Key) will be generated and automatically passed to the DQOps application. The API Key is now stored in the configuration file.
Execute the checks using the user interface
You can execute the checks using the user interface. Simply, open the DQOps User Interface Console (http://localhost:8888).
Navigate to a list of checks
To navigate to a list of checks:
-
Go to the Monitoring checks section.
The Monitoring checks section enables the configuration of monitoring data quality checks that are designed for monitoring data quality.
-
Select the table or column mentioned in the example description from the tree view on the left.
On the tree view on the left you can find the tables that you have imported. Here is more about adding connection and importing tables.
-
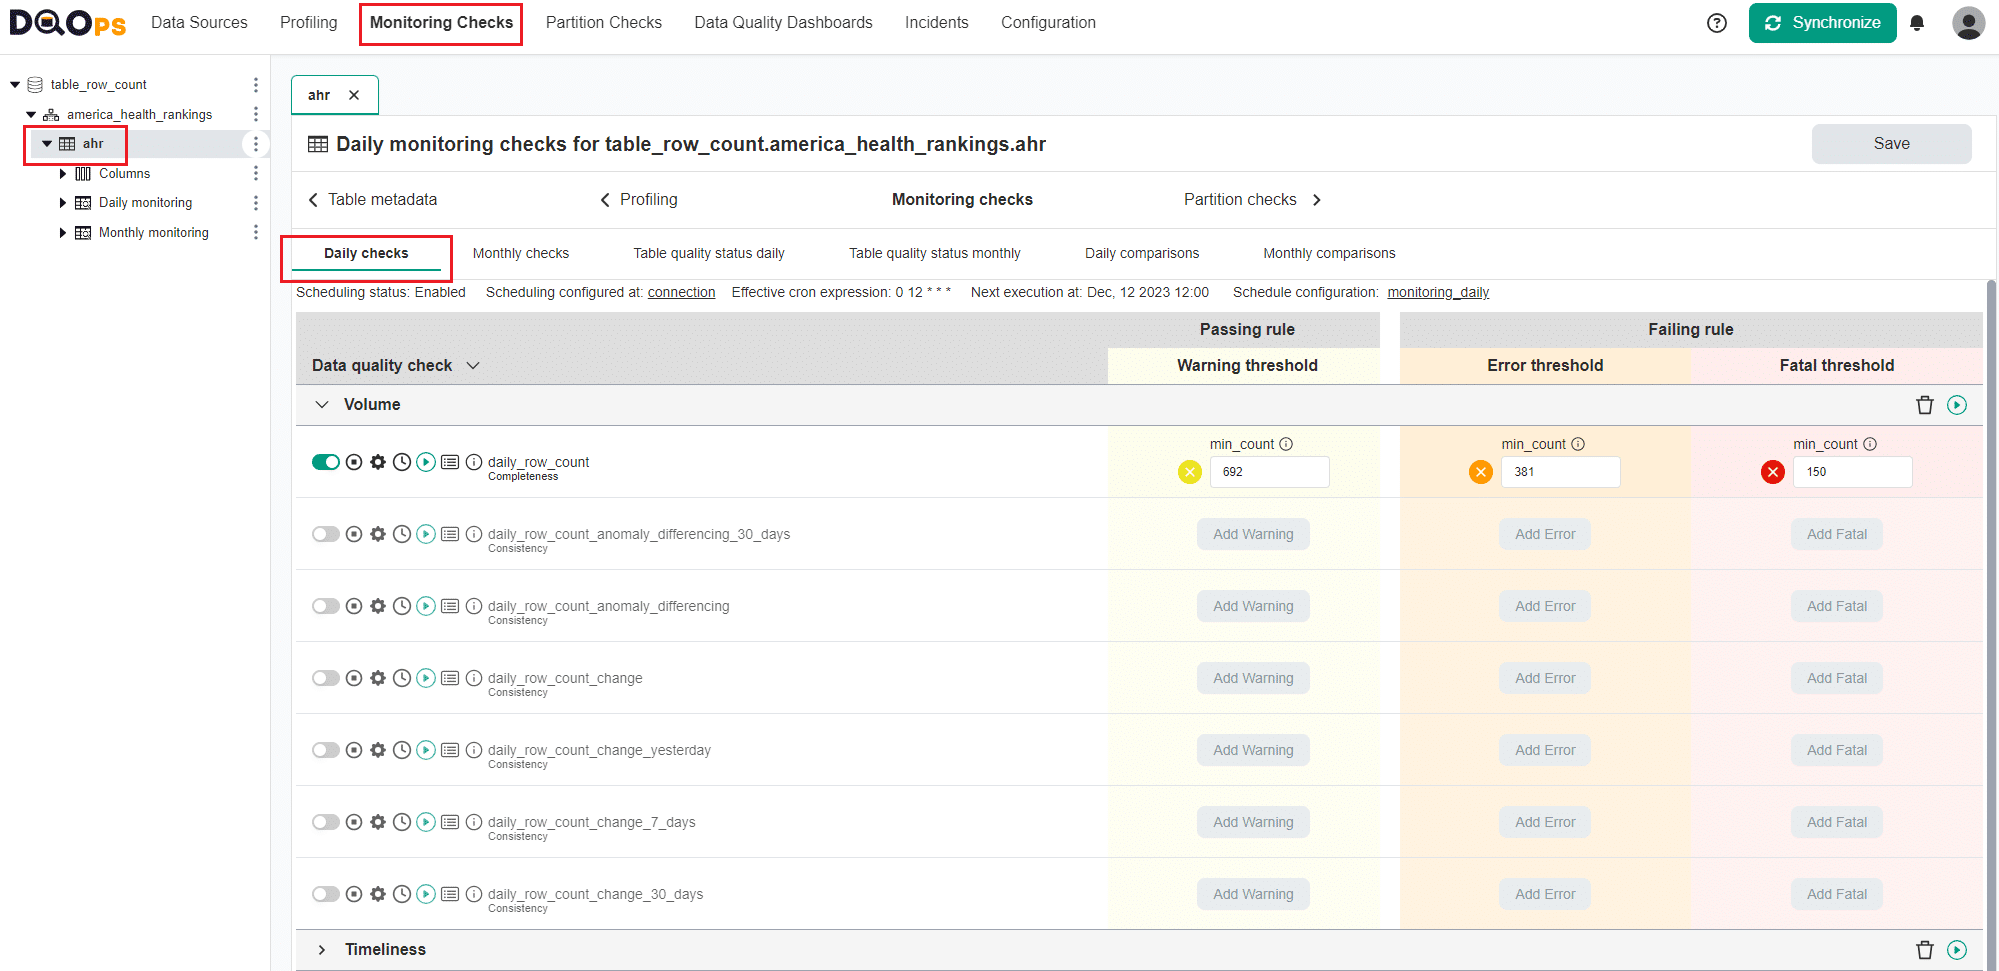
Select the Daily checks tab.
This tab displays a list of data quality checks in the Check editor. The table with data quality checks contains a list of checks divided into different data quality subcategories that you can expand and collapse by clicking on an arrow. Learn more about the different check subcategories.
Noticed the checks that have been activated have switched on the toggle button. The icons located before the name of each check allow you to: activate and deactivate it, configure settings, run a check, review results, and get more information about it.
The right side of the table allows setting different threshold levels (severity levels). Learn more about threshold levels.
Learn more about navigating the check editor.
Running the use cases
Run the activated check using the Run check button.
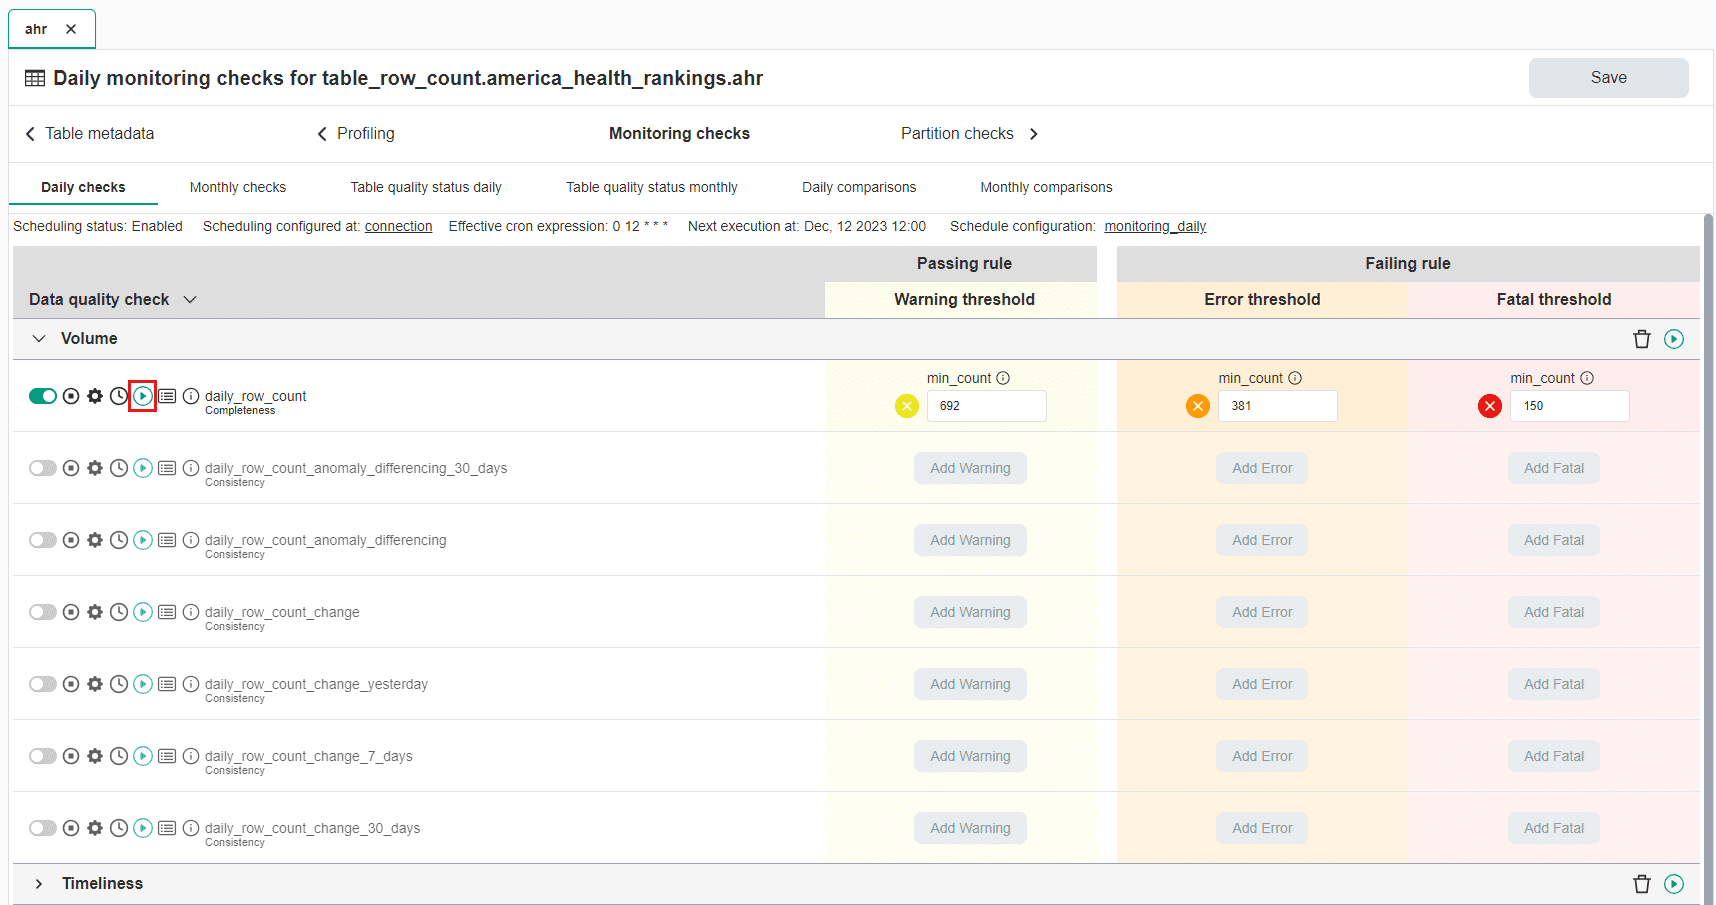
The results of the run check are shown as a color square
- Green for a valid result
- Yellow for a warning
- Orange for an error
- Red for a fatal error
- Black for execution error.
You can view the details by placing the mouse cursor on the square.
View detailed check results
Access the detailed results by clicking the Results button. The results should be similar to the one below.
Within the Results window, you will see three categories: Check results, Sensor readouts, and Execution errors. The Check results category shows the severity level that result from the verification of sensor readouts by set rule thresholds. The Sensor readouts category displays the values obtained by the sensors from the data source. The Execution errors category displays any error that occurred during the check's execution.

To see the results which you should expect, refer to the description of each example.
Synchronize the results with the cloud account
Synchronize the results with your DQOps cloud account using the Synchronize button located in the upper right corner of the user interface.
Synchronization ensures that the locally stored results are synced with your DQOps Cloud account, allowing you to view them on the dashboards.
You can now review the results on the data quality dashboards as described in the Working with DQOps section.
Execute the checks using the DQOps Shell
You can also execute the checks that were prepared in the example, using the DQOps Shell.
-
Just run the following command in DQOps Shell:
A summary table with the results will be displayed. To see the results which you should expect, refer to the description of each example.
-
After executing the checks, synchronize the results with your DQOps cloud account by running the following command.
-
You can now review the results on the data quality dashboards as described in the Working with DQOps section.