Last updated: April 09, 2024
DQOps user interface overview
This guide introduces the concept of DQOps user interface, how the screen is organized, how to work with multiple tables, and navigate across the platform.
Overview
The DQOps web interface is divided into three main areas.

- The navigation bar has links to the main DQOps data quality monitoring sections and provides access to the main settings and other functions.
- The tree view displays all the data sources available in your workspace or a list of dashboards depending on the section chosen in the navigation bar.
- The main workspace changes according to your selection in the navigation bar and the tree view.
Navigation bar
The navigation bar allows you to select the specific sections that you want to focus on.

- The Data Sources section allows you to add new connections, import schemas and tables, set up schedules, add comments and labels, configure data grouping, set the date and time columns for partition checks, and modify the settings of the incidents and notifications.
- The Profiling section allows you to collect and review basic data statistics, as well as enable and run profiling data quality checks that should be used to profile data and run experiments to see which check would be most appropriate for monitoring the quality of data.
- The Monitoring Checks section allows you to enable and run daily or monthly monitoring data quality checks that are standard checks that monitor data quality.
- The Partition Checks section allows you to enable and run daily or monthly partition data quality checks that measure data quality for each daily or monthly partition by creating a separate data quality score.
- The Data Quality Dashboards section lets you review the summaries of data quality monitoring on multiple built-in data quality dashboards.
- The Incidents section helps you review and manage the issues that arise during data quality monitoring.
- The Configuration section lets you customize built-in data quality sensors and rules.
The right side of the navigation bar provides access to the main settings and some other functions.

- Help - Links to the support page, documentation, DQOps account manager and configuration parameters settings set at the start of DQOps. You can change the configuration settings by setting command line arguments at the start of the application.
- Synchronize - Synchronize locally stored results with your DQOps Cloud account.
- Notifications - View DQOps notifications and enable/disable the scheduler. The Notifications icon displays NEW tag, when there is a new notification.
- User account - Provide information about your account, current limits and access to the DQOps Cloud account.
Tree view
The tree view at the Data Source, Profiling, Monitoring Checks and Partition Checks displays all the added sources and allows expanding its schemas, tables, and columns. Additionally, on the Profiling, Monitoring Checks and Partition Checks sections the three view contains the list of checks.
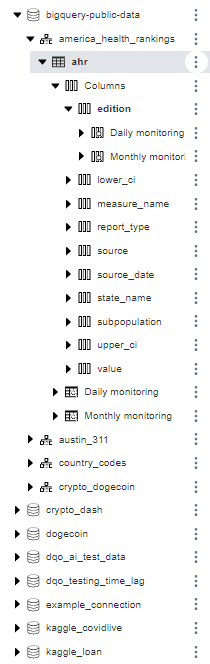
Clicking on an object in the tree view displays settings, statistics or a list of table or column data quality checks on the main workspace. Clicking on an object always opens a new tab in the main workspace.
Profiling, Monitoring Checks and Partition Checks tree view
In the Profiling, Monitoring Checks and Partition Checks sections, when you configure checks on any table or column, this table or column is displayed in bold on the tree view. In the Data Source section the bolded column or table name indicates that there is a check configured on any category.

Clicking on the tree vertical dots at the end of each element in the tree view in the Profiling, Monitoring Checks and Partition Checks sections opens a menu that allows to run the following functions:
- Run all activated checks on connection, schema, table or column
- Collect statistics
- Import metadata
- Add schema, table or column
- Refresh connection, schema, table or column
- Delete connection, schema, table or column
- Delete data
Data Quality Dashboards tree view
The tree view in the Data Quality Dashboards section displays the list of built-in dashboards divided into categories. When you hover your cursor over a dashboard name, thumbnails will appear.

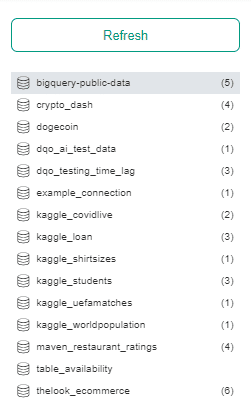
Incidents tree view
The tree view in the Incidents section displays a list of all added sources and the number of open incidents for the last 15 days (including today) in brackets.
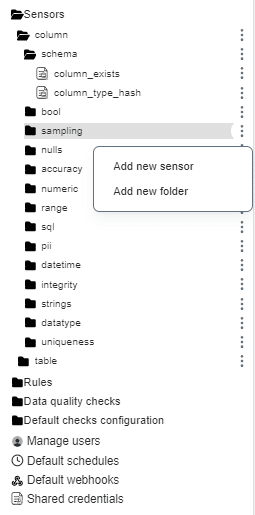
Configuration tree view
In the Configuration section, the tree view displays a list of all built-in data quality sensors, rules and data quality checks that can be customized. The tree view in this section also provides access to the configuration of the following:
- Default checks configuration: This allows you to configure checks that are automatically activated after importing new tables.
- Manage users: This allows you to add new users and manage their roles.
- Default schedules: This allows you to configure schedules that are automatically set after importing new tables.
- Defaults webhooks: This allows you to configure webhooks.
- Shared credentials: This allows you to add and manage shared credentials.
Main workspace
Once you select a section from the navigation bar and tree view, the main workspace will show you various data quality components. These include data source options, information about schemas, tables, and columns, a list of data quality checks, and data quality dashboards.
Clicking on an object in the tree view always opens a new tab in the main workspace that helps in navigating between open elements.
Tabbed interface
When you select an item from the tree view, it opens a new tab in the main workspace. You can open and close tabs within each section such as Data Source, Profiling, Monitoring Checks, Partition Checks, Data Quality Dashboards, Incidents and Configuration. Each section can have a maximum of seven tabs open at a time. If you try to add an eighth tab, the first one will be automatically removed to maintain the limit. These tabs are stored locally, which means that you can always return to them even after closing the application.

If the tab's content no longer exists, a pop-up notification will appear and the corresponding tab will close automatically.

Main workspace tabs
Below we explain the main tabs of the workspace in the Profiling, Monitoring Checks and Partition Checks sections.
The top section of workspace at the table and column level, contains quick links that allow you to switch between different sections while keeping the same level in the tree. The quick links section is hidden by default and can be expanded by clicking on the < arrow. For instance, if you are in the monitoring section on a table and click the Partition checks > link, you will be directed to the Partition check section on the same table. Linking works the same when you are on the column level.
Below the quick links are tabs that vary in different sections.
In the Profiling section you can access:
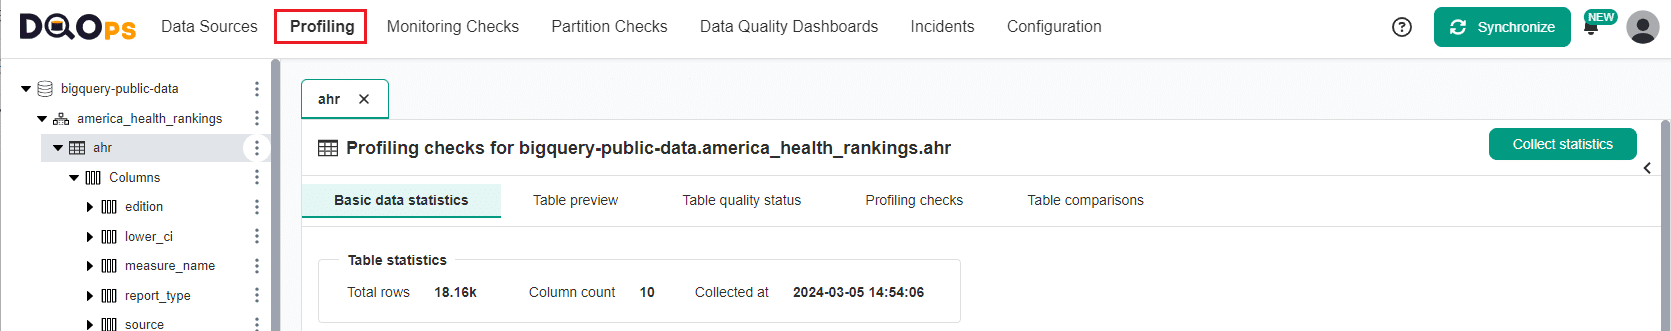
- Basic data statistics that allows you to collect basic statistics about data sources during the data profiling stage.
- Table preview that provides a summary preview of the table.
- Table quality status provides a summary of the results of the executed profiling checks.
- Profiling checks that gives access to the Check editor.
- Table comparison that enables you to identify differences between two tables.
In the Monitoring Checks section you can access
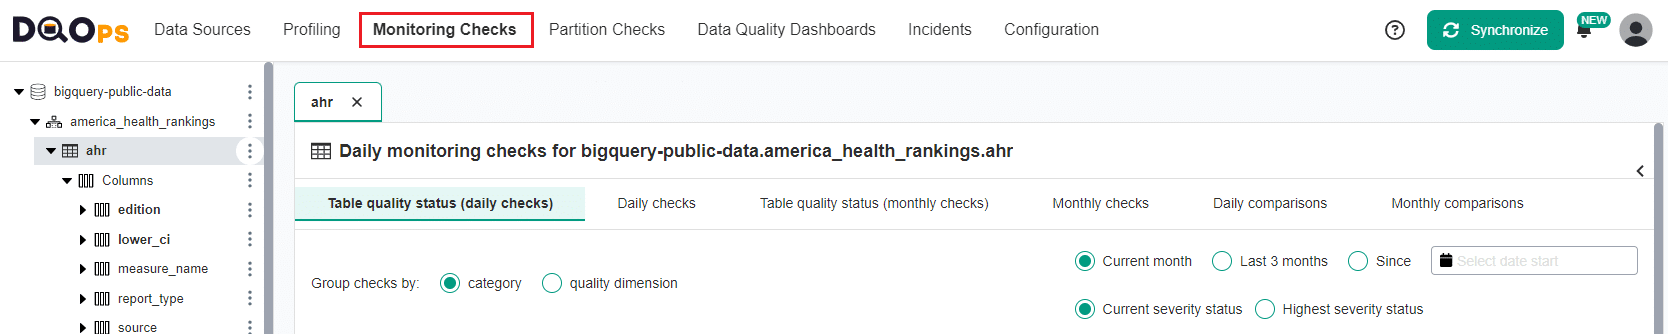
- Table quality status (daily checks) provides a summary of the results of the executed daily monitoring checks.
- Daily checks that gives access to the Check editor for daily checks.
- Table quality status (monthly checks) provides a summary of the results of the executed monthly monitoring checks.
- Monthly checks that gives access to the Check editor for monthly checks.
- Daily comparisons that enables you to identify differences between two tables using daily checks.
- Monthly comparisons that enables you to identify differences between two tables using monthly checks.
In the Partition Checks section you can access
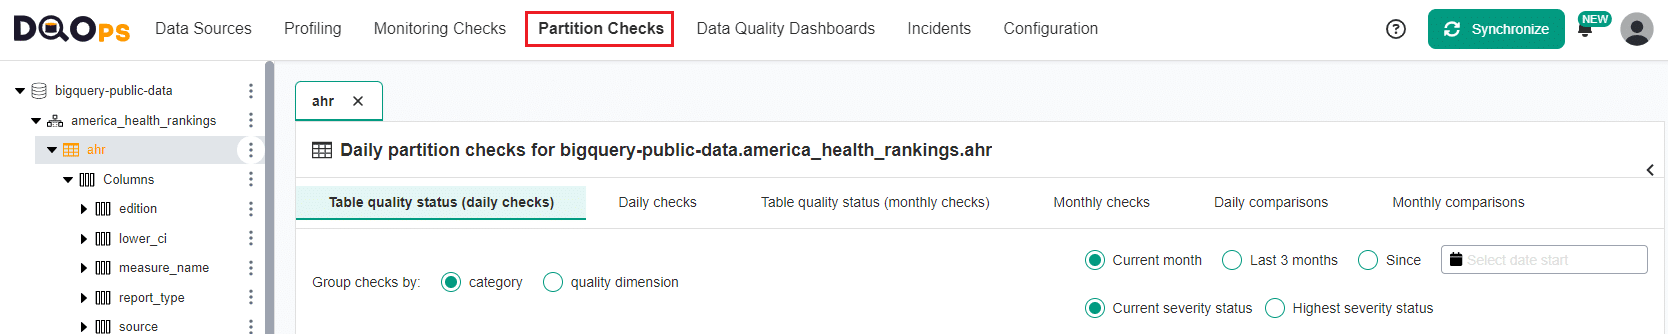
- Table quality status (daily checks) provides a summary of the results of the executed daily partition checks.
- Daily checks that gives access to the Check editor for daily checks.
- Table quality status (monthly checks) provides a summary of the results of the executed monthly partition checks.
- Monthly checks that gives access to the Check editor for monthly checks.
- Daily comparisons that enables you to identify differences between two tables using daily partition checks.
- Monthly comparisons that enables you to identify differences between two tables using monthly partition checks.
Check editor
The Check editor screen allows you to work with checks.

Under tabs selection, there is information about the set schedule configuration. Also, in the Partition Checks section, there is additional information about the date partitioning column.
The table with data quality checks contains a list of checks divided into different data quality subcategories that you can expand and collapse by clicking on an arrow. Learn more about the different check subcategories. By clicking on the Show advanced checks checkbox you can view all checks available in DQOps.
The right side of the table allows setting different threshold levels (severity levels). Learn more about threshold levels
On the left of the name of each check, there are several buttons and icons. And under the name of the check, there is a data quality dimension category to which this check was categorized.
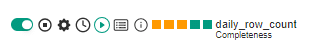
The buttons and icons allow you to:
- Activate and deactivate checks by using the toggle button. The toggle button next to the name of the activated default checks will have a light green color. If the check has been activated manually, the toggle button will have a darker green color. Learn more about monitoring data quality with default check here.
- Disable checks by using the Disable button
-
Access check Settings where you can set Custom data groupings, modify inclusion/exclusion of check in KPI and SLA, modify the name of the Data Quality Dimension, add SQL WHERE condition, modify scheduling settings, or add Labels.
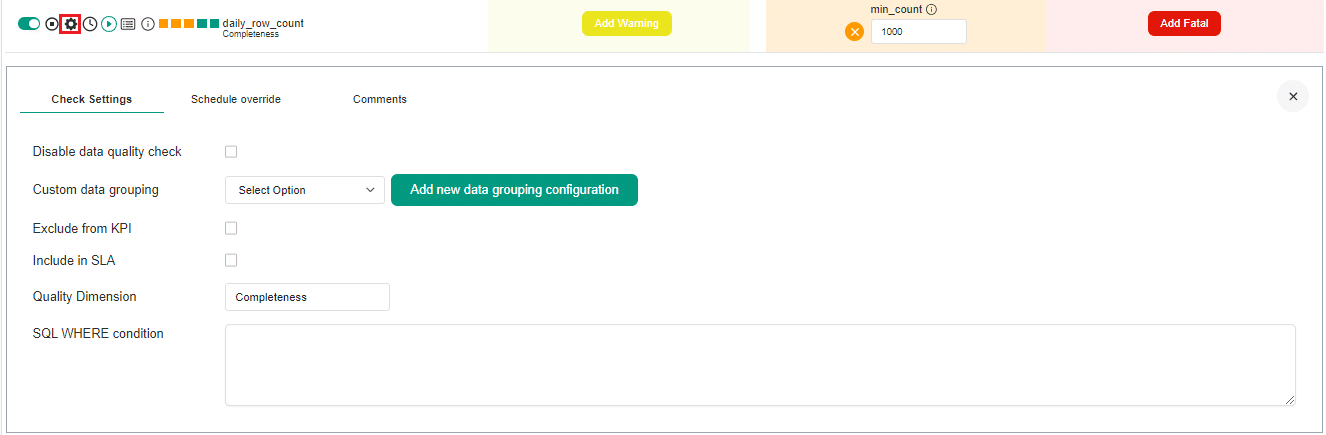
-
Check schedule status.
- Run data quality checks
-
View detailed results for checks, Sensor readouts, and Execution errors
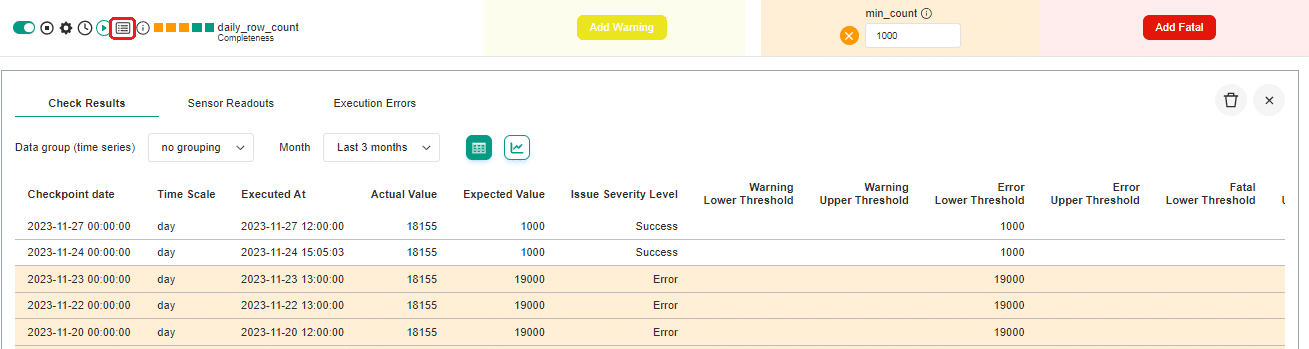
-
View detailed information about check.
- Check the results of the run check shown as a color square
- Green for a valid result
- Yellow for a warning
- Orange for an error
- Red for a fatal error
- Black for execution error.
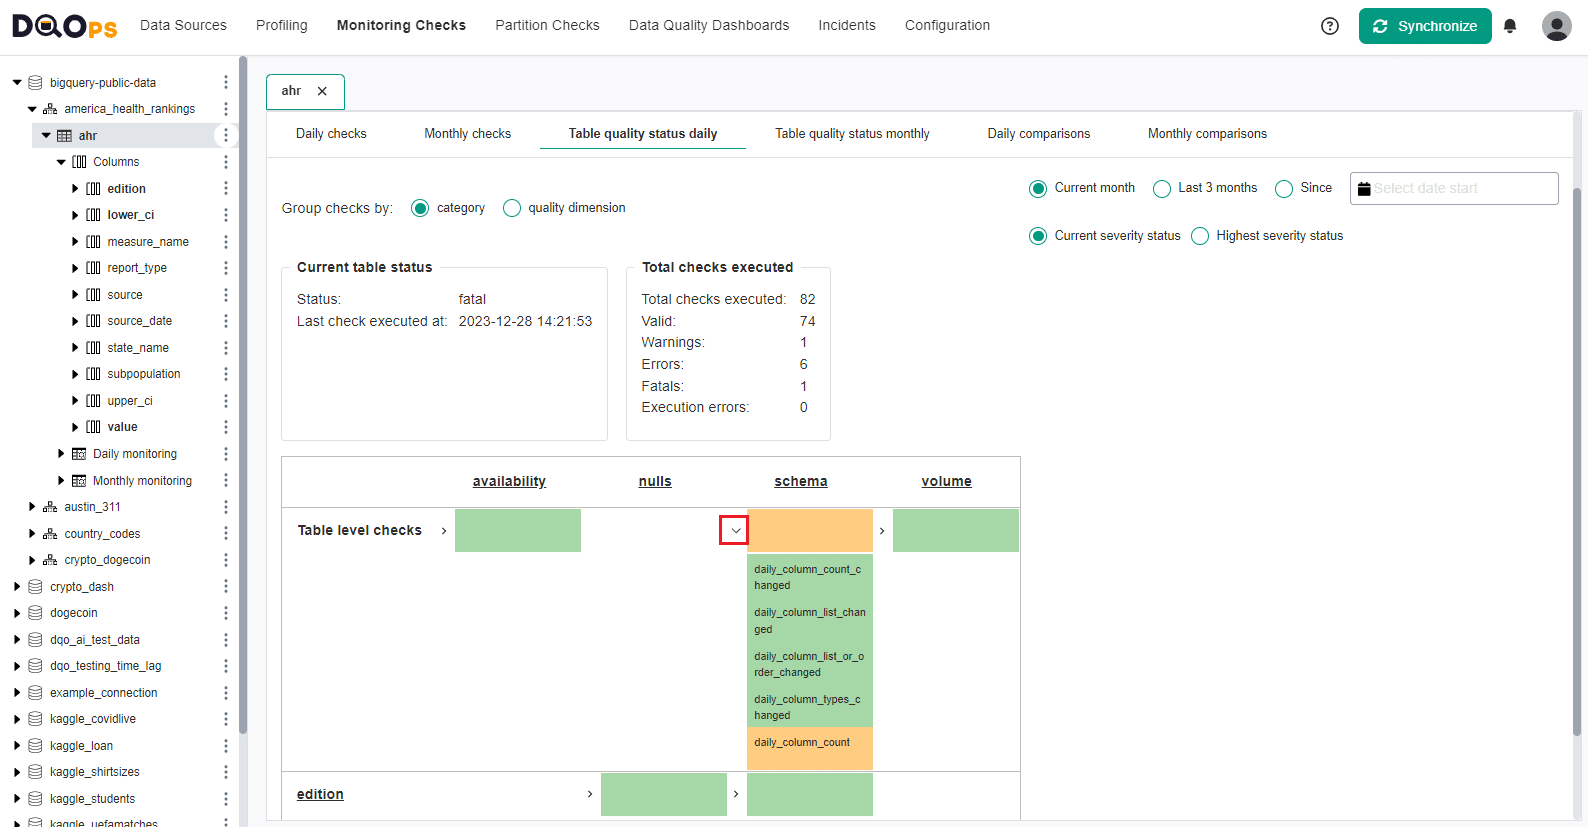
Table quality status
In the Profiling, Monitoring Checks, and Partition Checks, there is a tab called Table quality status. This tab provides a summary of the results of the executed checks, grouped by check category or data quality dimension.

By using the radio buttons in the upper right corner of the screen, you can view the results for the Current month, Last 3 months, or select a specific starting date. You can also switch between viewing the Current severity status and the Highest severity status.
There are two tables on the left-hand side of the screen, which show the Current table status and the summary of the Total checks executed.
Below these tables, there is a table with the Current severity statuses divided by the check category or data quality dimension, depending on the selected option. The first row displays the results from the table-level checks executed on the table, while the following rows show the column names and the results from the executed column-level checks. The color indicate the current or the highest severity status:
- green for a valid result
- yellow for a warning
- orange for an error
- red for a fatal error
You can view the list of executed checks by clicking on the arrow. Hovering over a check name will display more details.
Notifications
Notifications provide a log of all completed tasks, such as running checks, gathering statistics, importing metadata, synchronizing folders, etc.

You can use the notifications to access a complete log of all jobs that have been executed. This log allows you to check the status of each action, which can be "finished," "failed," "running," "waiting," "queued," or "canceled." Additionally, you can expand each job entry to view sub-jobs and access more detailed information about specific tasks.
Enable and disable scheduler
In the top part of notifications window you can start and stop the scheduler. You can learn more about scheduling here.

Cancel a queued or running job
If the job is queued or running you can cancel or stop it by clicking the X button.

Run checks summary
You can view the result of executed checks by simply hovering on run checks job. Color of the square represents the highest severity status of the results (green for a valid result, yellow for a warning, orange for an error and red for a fatal error).

What's next
- Check the detailed process of running data quality checks and all DQOps engine internal components involved in the process in the Data quality check execution flow section.
- You haven't installed DQOps yet? Check the detailed guide on how to install DQOps using pip or run DQOps as a Docker container.
- DQOps allows you to keep track of the issues that arise during data quality monitoring and send alert notifications directly to Slack. Learn more about incidents and Slack notifications.