Last updated: April 09, 2024
How to measure data quality KPI metrics - definition and formula
Learn how to measure the data quality KPI metrics with DQOps, what is the formula used to calculate the score, and how to improve data quality following KPIs.
Purpose of data quality KPIs
The purpose of data quality KPIs (Key Performance Indicators) is to measure data quality by calculating a reliable data quality score. The score will be used to assess the health and quality of data sources. It can be also used to verify compliance with data quality requirements agreed in a data contract between a data producer and a data consumer.
We can divide the data quality KPIs into business-focused and data engineering-focused.
- The data quality KPIs for business help monitor data quality to proof the trustworthiness of data.
- The data quality KPIs for data engineering monitor the problems with the data pipelines, allowing the data engineering teams to improve the data platform.
The data quality metrics should be also calculated at a physical level, measuring the KPI of each
- data source
- database schema
- table
- column
Beyond monitoring physical entities such as tables, the data quality KPI metrics should be also calculated at logical levels
- data domain in a data mesh architecture
- data producer
- external vendor that is providing data as part of their service contract
- data contract
DQOps calculates the data quality KPI metric as a value between 0% and 100%, which is the percentage of passed data quality checks. A percentage KPI is the easiest way to share between all stakeholders, including the data teams, data stewards, data owners, data producers, and data consumers.
Beside calculating the data quality KPI for each physical and logical groups of data, the KPI must also support identifying the type of data quality issue. For that purpose, all data quality check results are attributed with the name of a data quality dimension, allowing to identify the type of problem.
Data quality score formula
DQOps calculates data quality KPIs as a percentage of passed data quality checks out of all executed checks. The data quality KPI is represented as a percentage value. The following formula calculates the score.

The result of measuring the data quality KPI for two data quality checks, daily_nulls_percent and daily_duplicate_percent on 5 columns over the period of 10 days is shown below.

Passed data quality checks are shown as green boxes. Data quality issues that decrease the data quality KPI are shown as orange (error severity issue) and red (fatal severity issue) boxes.
Issue severity levels
DQOps supports configuring data quality rules at three severity levels:
-
warning severity issues are dedicated for anomalies and less severe data quality issues that the data producer (the data owner) should not be accountable because those type of issues are expected. The warning severity issues are calculated as passed data quality checks, not decreasing the data quality KPI.
-
error severity issues are dedicated for data quality issues that should be resolved over time. They are counted as failed data quality checks in the data quality KPI, decreasing the final score.
-
fatal severity issues are dedicated for very severe data quality issues that should even be detected inside the data pipelines. When a fatal issue is detected, the data pipeline should be stopped to prevent from spreading the data quality issues into the down stream tables. Similar to error severity issues, fatal severity issues are also counted as failed data quality checks, decreasing the data quality KPI.
The effect of warning severity issues on the data quality KPI formula used in DQOps is shown below.

The reason for treating warning severity data quality issues as passed data quality checks is due to the nature of warnings. Warnings should be raised only for anomalies or data quality issues that are expected occasionally, and will be reviewed when they are detected. Warnings should be also raised for data quality issues that are outside the agreed data contact between the data producer and the data consumer.
The updated data quality KPI formula is shown below. The number of valid data quality results plus the number of warnings is divided by the total number of data quality results, including both passed data quality checks and errors.

Excluding data checks from KPI
The data quality issues can be divided into two groups
-
Data quality issues that the data producer should be accountable for, they should be included in the KPI score
-
Random data quality issues that are occasionally expected, or the data producer is not able to fix them because the data is received from an external source. For example, the data engineering team that has set up the data pipeline to load data received from a CRM platform is responsible for loading the data correctly, but cannot be make accountable for missing data (completeness issues), when the data was not entered by the sales team.
Data quality checks are excluded from KPI calculation in the check's settings section in DQOps as shown below.

The configuration is stored in the exclude_from_kpi field in the YAML file, as shown below.
- To exclude the check from the KPI score, set the value to true. The default value of this field is false.
Improving data quality with KPIs
Sharing KPIs with stakeholders
Measuring and increasing the data quality KPIs is the most reliable way to run a data cleansing project. The biggest challenge that each data team faces when introducing data quality practices is gaining the support from the upper management. The management expects to see the progress and a proof of success. Sharing the data quality KPI with the upper management is the best way to gain secure financing for data projects.
Reaching 100% data quality KPI score

DQOps team has written an eBook "A step-by-step guide to improve data quality" that describes their experience in data cleansing and data quality monitoring using DQOps.
The eBook desribes a full data quality improvement process that allows to reach ~100% data quality KPI score within 6-12 months.
The process described below is a simplified version of the full process described in the eBook.
Data quality improvement process
An agile data cleansing project that is driven by data quality KPIs is shown below.
graph LR
  I(Identify high<br/> priority tables) --> S;
  S(Capture statistics<br/> and run <strong>profiling</strong> checks) --> P
  P(Review profiling<br/> issues) --> M;
  M(Activate <strong>monitoring</strong><br/> and <strong>partitioned</strong> checks) --> O
  O(Observe KPIs<br/> and issues) --> |KPI decreased| R;
  R(Review issues) --> |Root cause<br/> identified| F;
  F(Fix data<br/> or recalibrate checks) --> |Continue observing| O;
The main steps are described in the following sections.
Prioritize tables
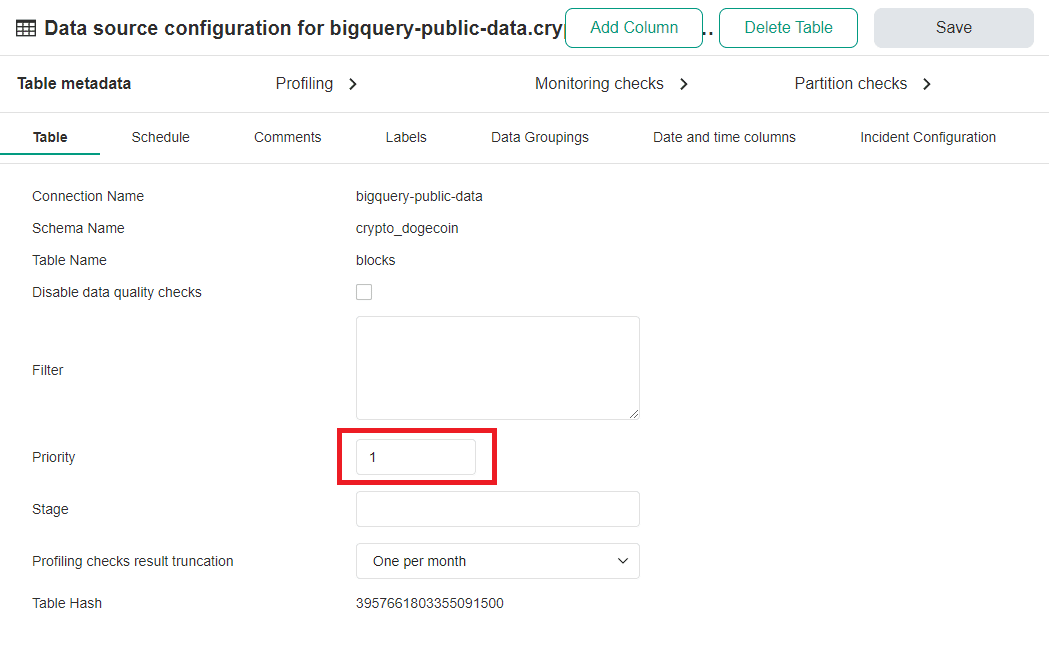
A successful data quality improvement process requires showing visible progress to data stakeholders, cleansing the most important tables within the first weeks of the project.
DQOps uses numeric priorities (1, 2, 3, ...) configured on the table's metadata screen in the Data Sources section as shown below.
Profile tables
Profile the data sources by calculating basic statistics and running profiling checks. Profiling checks in DQOps are designed to be run once a month to capture the initial data quality KPI score. During the data profiling stage, you will probably activate a lot of ~150+ data quality checks supported by DQOps, just to see if they pass. In our experience, when all profiling checks that are reasonable are activated, only 40% of checks pass (the data quality KPI is only 40%). The remaining 60% of failed profiling checks are mostly not data quality issues. The data quality profiling checks fail because the documentation of the data source is incomplete, or simply wrong parameters were passed to data quality rules, expecting to have <20% of null values in a column, while the column is sparse and mostly empty.
In order to exclude the results of the invalid profiling checks from the initial data quality KPI score, you can open the delete data quality results popup and delete any combination of data quality results. If the orphaned results of failed data quality checks are not removed, they will decrease the data quality profiling KPIs.
The profiling KPI scorecard dashboard is shown below. The dashboard can be found in the Data Quality Dashboards -> Profiling -> Profiling data quality KPIs section.

Once the data profiling is complete, it will be clear which data quality issues are real issues, and which failed profiling checks should not be measured, since some columns may be incomplete. The selected list of profiling checks should be activated as monitoring and partitioned checks.
Activate monitoring checks
Choose which profiling checks should be used for monitoring and measuring the data quality KPI. Activate those checks as daily monitoring checks or daily partitioned checks (for partitioned data). DQOps uses a data quality check naming convention for similar profiling, monitoring and partitioned checks. The names of profiling checks begin with a profiling_ prefix, while the daily monitoring (and partitioned) checks begin with the daily_ prefix.
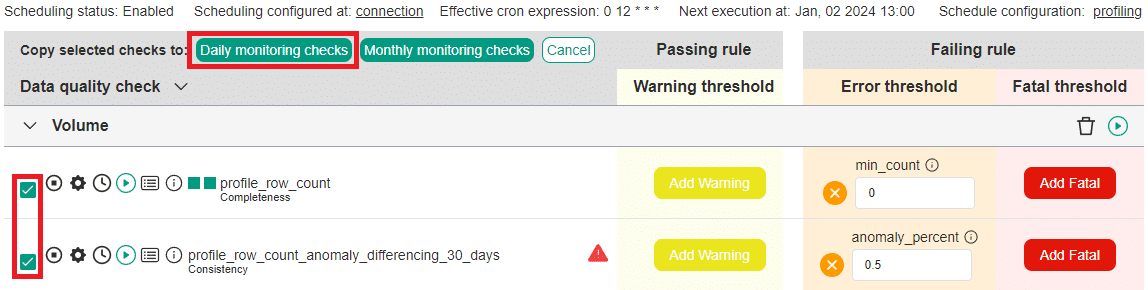
Migrating similar data quality checks between types is also supported directly in the check editor. Activate the copy tool by clicking the Set up monitoring checks button.

Select the checks that should be copied, and click the "Daily monitoring checks" or "Monthly monitoring checks" buttons, depending on the frequency of running the checks. Daily monitoring checks will capture one data quality score per day, overwriting previous results if the check is reevaluated during the day. Monthly monitoring checks will capture only one result per month, overwriting data quality results captured on previous days.
Observe data
The next step is a continuous data observability process. DQOps will run configured monitoring and partitioned checks daily, detecting data quality issues that will be included in the data quality KPI score.
The data quality improvement process is a continuous loop between
-
DQOps detects a new data quality issue, decreasing the data quality KPI
-
The issue is reviewed
-
Valid issues are assigned to the data engineering teams, or the data producer is contacted to fix the data at the source
-
The data quality KPI scores are reviewed for each data source, table, vendor, and data quality dimension
-
Tasks are planned to fix data quality issues
-
Data quality checks are executed again after the data issue was solved, to verify the fix
-
Data quality KPIs are reviewed again
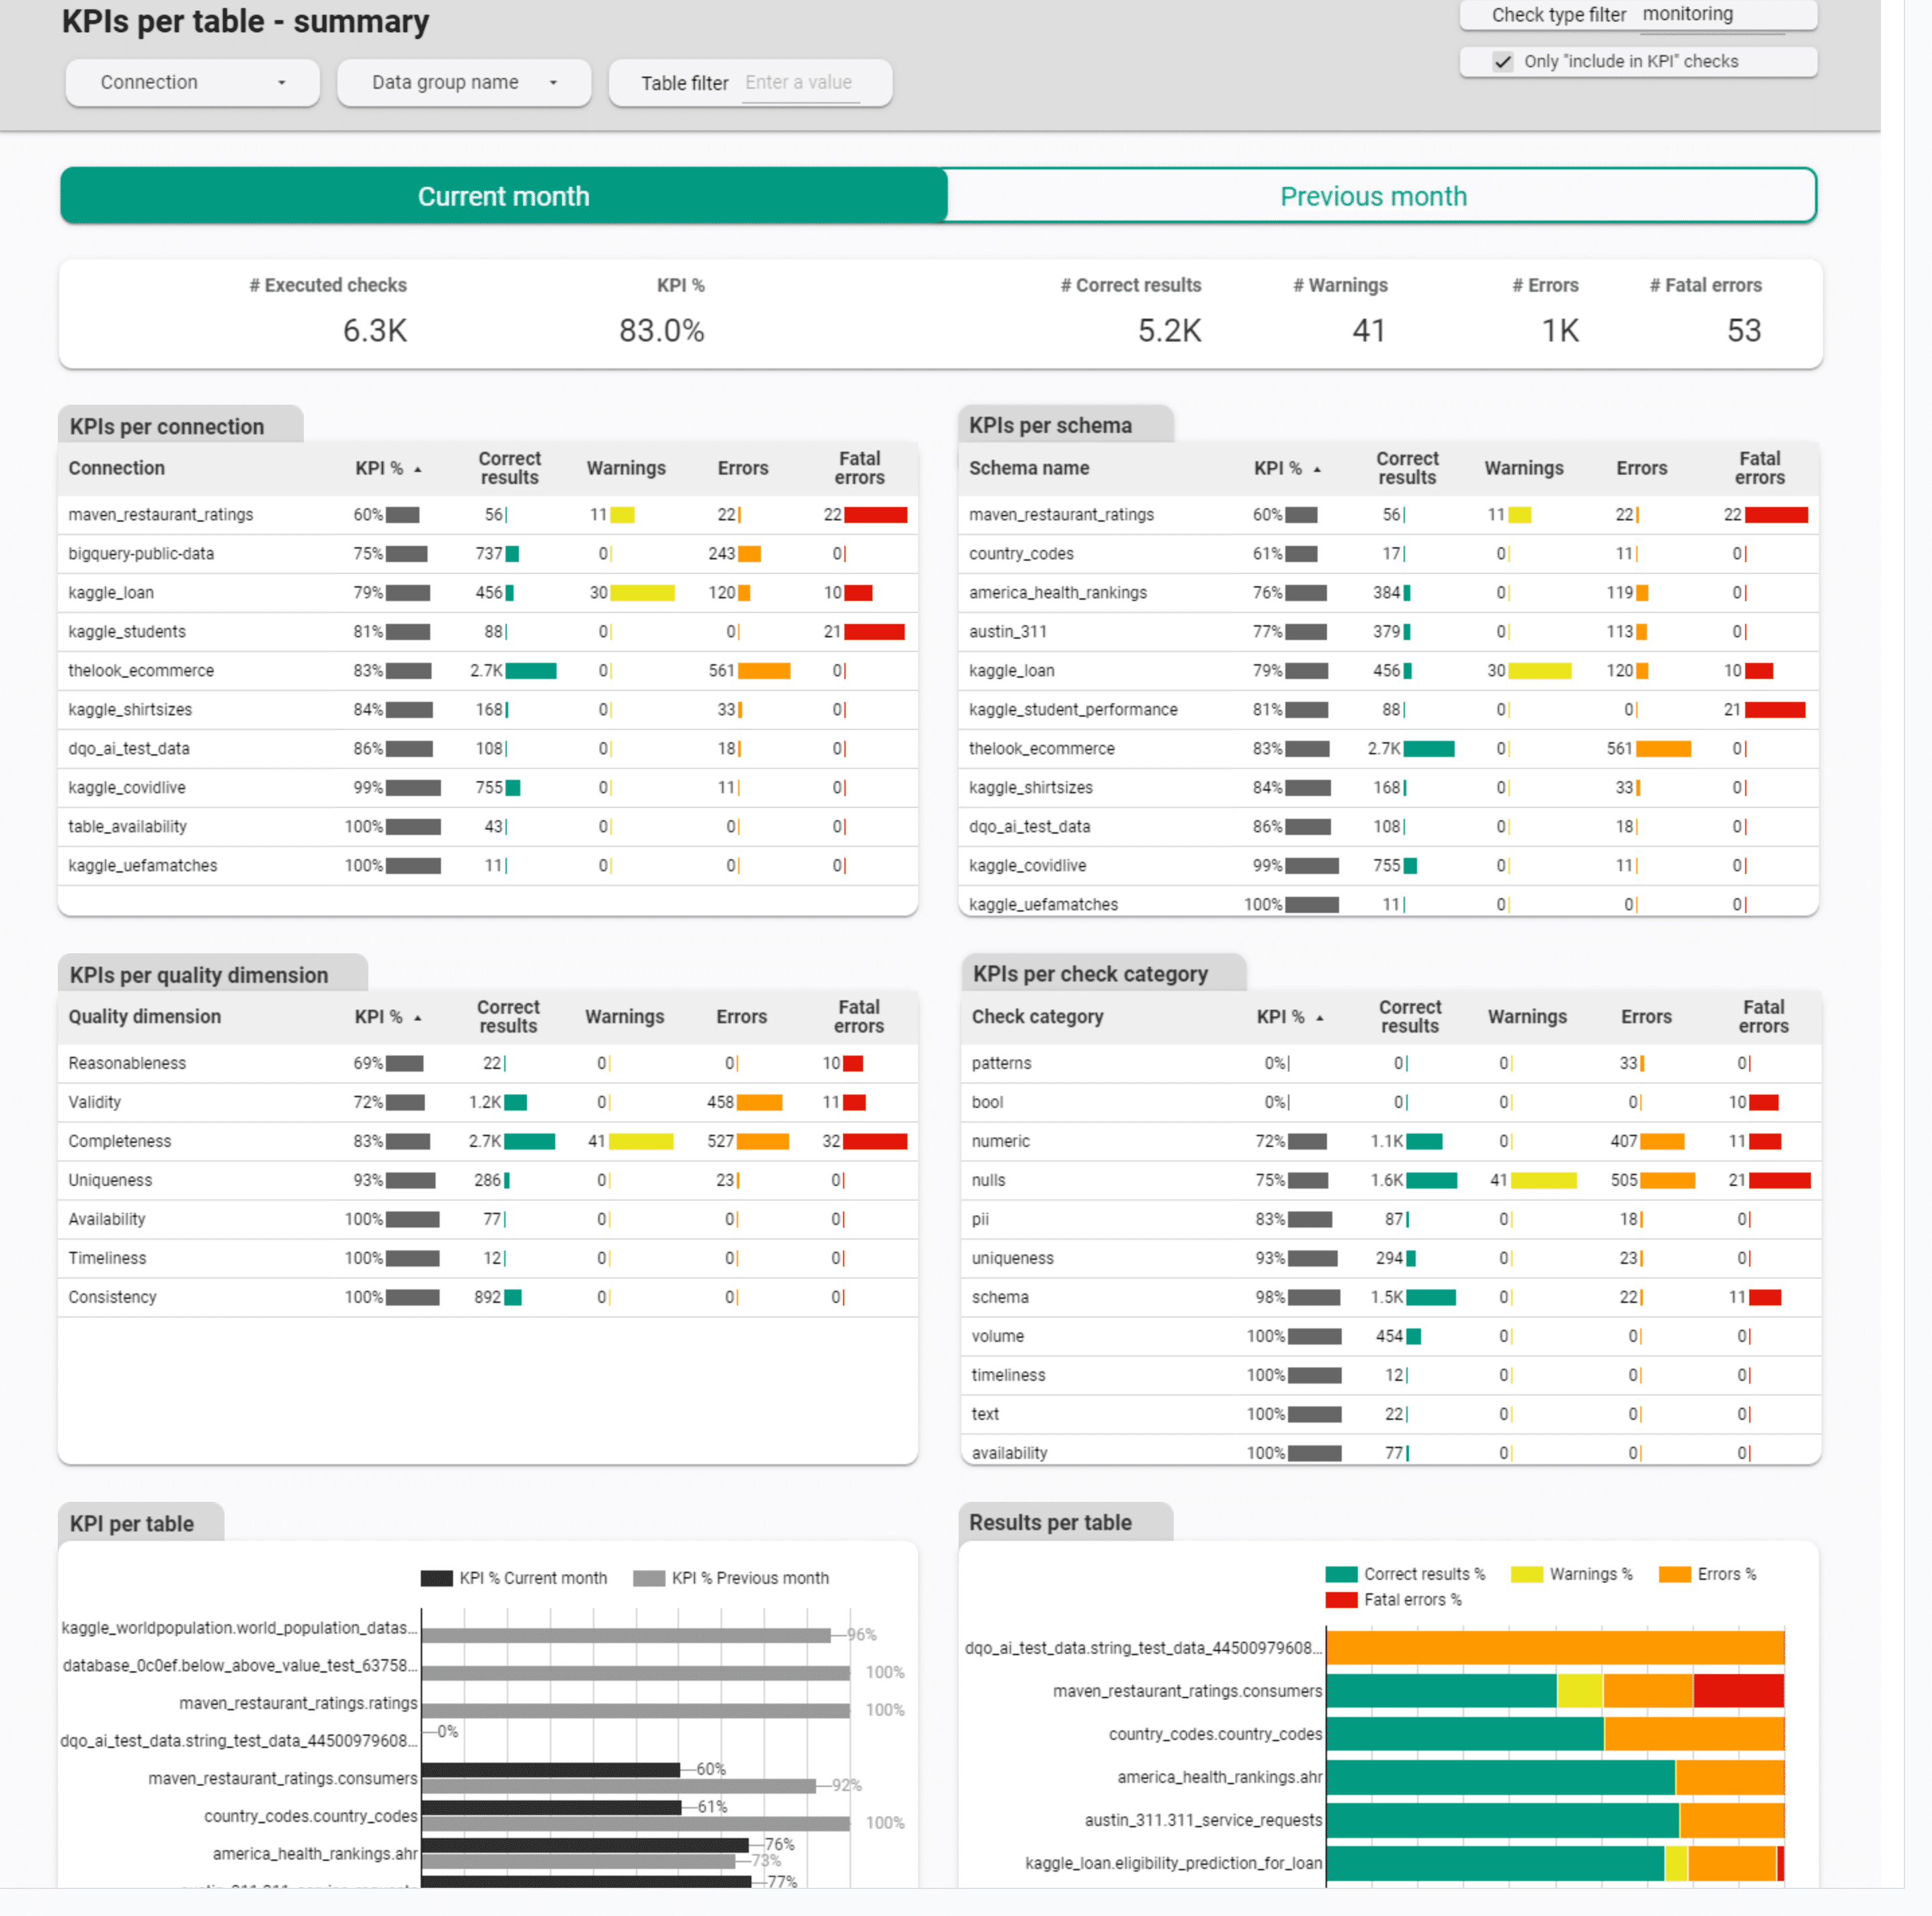
The following screenshot shows one of data quality KPI dashboards with drill-down options for locating the type of the data quality issue. This dashboard can be found in the Data Quality Dashboards -> Monitoring -> Data quality KPIs section.
Data contracts
Data contract verification
Data contracts are a modern way to document the format of published data, and verify the compliance of data with the agreed contract. The responsibility for defining the data contract is on the data producer side, but the data consumer should verify if the received data meets the data contract.
Data contracts are defined for various areas, including
- table metadata
- data types
- data refresh frequency
- foreign key constraints
- data formats
- nullability and completeness
- allowed values for each column
- daily volume
- documentation of the tables
- who owns the data
The areas of the data contract that can be verified with data quality checks are highlighted in bold. Those areas should be measured at least daily or after each data loading operation, to verify that the data is compliant with the data contract. The level of compliance can be measured with a data quality KPI that proves that both the data producer ensured that the data is compliant, and the data consumer reviewed the compliance with data quality checks to ensure that the data has not been corrupted on the way.
DQOps data quality checks that are defined in .dqotable.yaml files are a simple way to define the data contract that can be shared between the data publisher and the data consumer, also ensuring compliance with KPIs.
Sharing data
DQOps can be used by the data publisher to proof that the data quality was verified for every batch of data, and the data quality meets the requirements defined in the data contract, measured with a KPI.
The data publishers who should verify the quality of published data are
-
data domain owners, especially in a data mesh architecture
-
platform owners, who provide access to their databases
-
data engineering teams responsible for maintaining data warehouses used by other teams
-
external vendors, who are also required to share data files with detailed information
- marketing agencies
- suppliers
- subcontractors
- distributors
Receiving data
The team or organization who receives data is called a data consumer. The data consumer can integrate DQOps as part of the data pipeline to ensure that no fatal severity issues are detected, and the total data quality KPI meets the target.
Please review the samples in the integration with Airflow article in the integrations section.
Aggregation of data quality KPIs
Monthly KPI aggregation
The default data quality KPI aggregation scale used by data quality dashboards in DQOps is monthly aggregation. The data quality dashboards are grouping data quality check results on the time_period column, which stores the day or month when the data quality check was executed.
The data quality KPIs in monthly periods are calculated as the percentage of passed data quality checks, that were executed during the month. Data quality dashboards in DQOps truncate the time_period columns to the first day of the month for aggregating the results in monthly periods.
| Month (truncated time_period) | Executed checks | Passed checks | KPI value |
|---|---|---|---|
| 2023-01-01 | 1000 | 951 | 95.1% |
| 2023-02-01 | 1000 | 962 | 96.2% |
| 2023-03-01 | 1000 | 945 | 94.5% |
| 2023-04-01 | 1000 | 947 | 94.7% |
Data quality KPIs in DQOps are calculated in monthly periods because this scale allows to notice changes in the data quality score during recurring data quality review sessions. Month-to-month changes to the data quality KPI can be reviewed using drill-down dashboards. The data engineering team can plan implementation tasks such as rebuilding a data pipeline that is loading corrupted data.
Daily KPI aggregation
Sample data quality KPIs aggregated at a daily level are shown in the table below.
| Time period | KPI value |
|---|---|
| 2023-10-01 | 95.1% |
| 2023-10-02 | 96.2% |
| 2023-10-03 | 94.5% |
| 2023-10-04 | 94.7% |
The data quality dashboards such as the KPI history dashboard shown below can aggregate the data quality KPI per day. Please look at the last chart with KPI calculated for the whole previous month.

Monthly with data quality dimensions
The data quality KPIs are most relevant, when aggregated both at the monthly period, and divided by the data quality dimension, as shown in the following table.
| Month | Timeliness | Completeness | Validity |
|---|---|---|---|
| 2023-01-01 | 96.1% | 97.4% | 95.1% |
| 2023-02-01 | 99.2% | 94.6% | 96.2% |
| 2023-03-03 | 94.6% | 97.0% | 94.3% |
| 2023-04-04 | 99.1% | 93.2% | 94.7% |
By groups of rows
Additionally, data quality KPIs can be calculated for each data group.
Tracking the data quality for groups of rows identified by the discriminator column makes it possible to identify data received from different data sources, but ultimately aggregated into a single table. The discriminator column can be a country name, state name, vendor name, or supplier name.
DQOps supports running data quality checks as SQL queries with a GROUP BY clause. Please read about data segmentation in the concept of data grouping article.
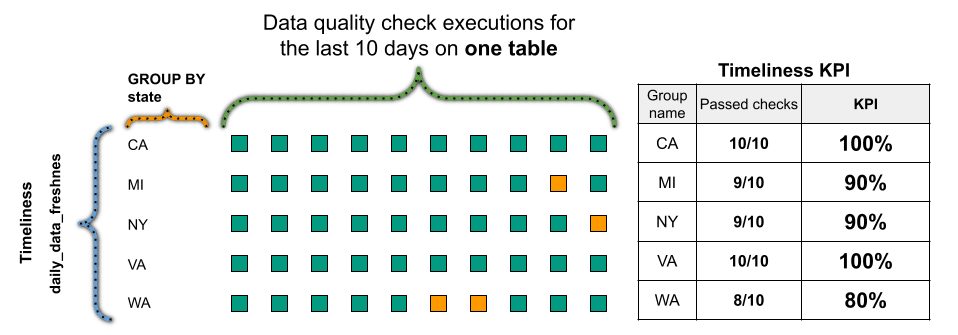
The following data quality KPI formula shows how DQOps measures the score for each group of rows, when the data is grouped by a state column that contains US state names.
By groups of rows and dimensions
Data quality KPI can be also aggregated both by the data group name and data quality dimension. Sample results are shown in the table below.
| Month | Data Source (state) | Timelines | Completeness | Validity |
|---|---|---|---|---|
| 2023-10 | CA | 96.1% | 97.4% | 95.1% |
| 2023-10 | MI | 99.2% | 94.6% | 96.2% |
| 2023-10 | NY | 94.6% | 97.0% | 94.3% |
| 2023-10 | WA | 99.1% | 93.2% | 94.7% |
The data quality KPI formula for splitting scores by the data group name and data quality dimension is shown below.

The data quality dashboards provided by DQOps that show the results aggregated by data group names and data quality dimensions are
- Profiling -> Data quality KPIs -> KPIs per quality dimension and data group for profiling checks, showing the initial data quality score
- Monitoring -> Data quality KPIs -> KPIs per quality dimension and data group for monitoring checks, showing data quality scores observed by regular full-table monitoring
- Partitions -> Data quality KPIs -> KPIs per quality dimension and data group for partitioned checks, showing data quality scores for daily and monthly partitions
By groups of tables
DQOps supports also calculating data quality KPIs for groups of tables. This type of KPI aggregation is useful when
- tables are grouped by data source
- tables are grouped by geography (country, state, etc.)
- business owner
Please read the concept of data grouping by tags article to see how to assign tags to tables.
The following data quality KPI formula shows how DQOps can measure timeliness for tables tagged by a state name.

What's next
- Look at some built-in data quality KPI dashboards
- Read about build-in data quality dashboards
- Learn how DQOps assigns data quality checks to data quality dimensions
- Learn how to review results of data quality monitoring results on dashboards
- Find out how data quality KPIs are measured incrementally for partitioned data