Last updated: April 14, 2024
What is a data quality check
Data quality checks are responsible for detecting data quality issues, and asserting the data quality requirements for monitored data sources.
Data quality check definition
In DQOps, a check is a data quality test that can be run on both table or column levels. The data quality check consists of a data quality sensor and a data quality rule.
The data quality sensor reads the value from the data source at a given point in time. The data quality rule includes a set of conditions (thresholds) that the sensor readout must meet. When the conditions are not met, the check detects an issue with your data, and it creates an incident that can be viewed, filtered, and managed.
The components involved in running a data quality check are shown below. The example below shows how DQOps performs the daily_row_count data quality check that verifies if the number of rows in the monitored table is greater than the expected minimum row count.

The data quality check is evaluated on a monitored table (or column) in three phases.
-
The placeholders for the table name (and column name) sensor template are filled in a templated SQL query (called a data quality sensor)
-
The generated SQL query is executed on the data source, capturing the data quality measure. It is expected that all data quality sensors in DQOps will return a result column named actual_value as a data measure, which will be evaluated with data quality rules.
-
The data quality metric (called sensor readout in DQOps) is passed to a data quality rule that is a Python function. The function determines if the measure (sensor readout) should be accepted or if the data quality check should fail and generate a data quality issue at one of three severity levels: warning, error, or fatal.
The data quality measure (sensor readout) is passed up to three data quality rules because data quality rules for warning, error, and fatal severity levels use different parameters (thresholds).
Activating data quality checks
DQOps user interface
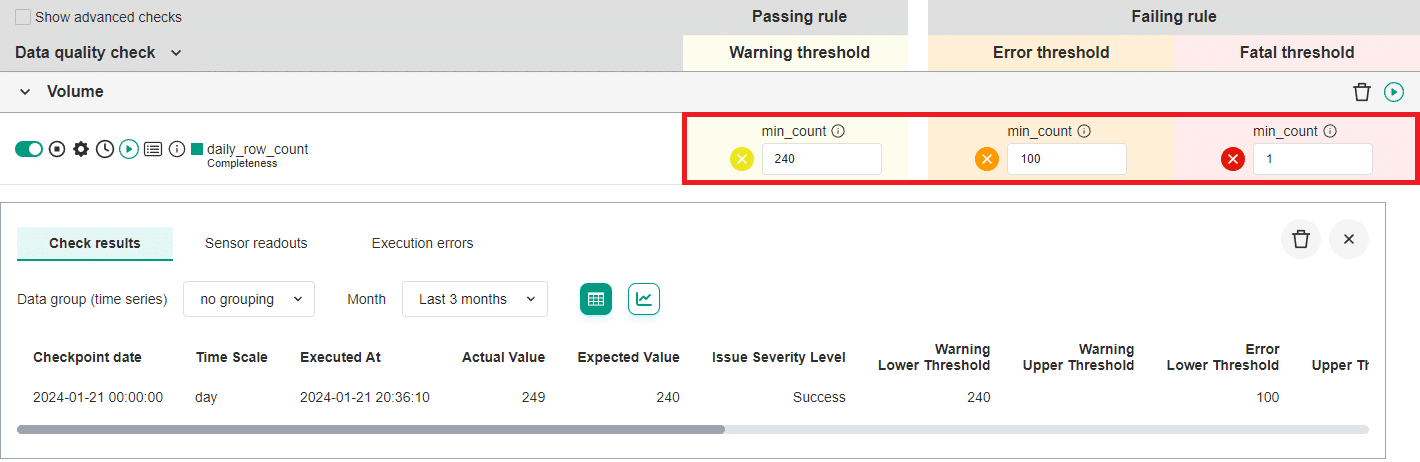
Data quality checks are activated in the DQOps user interface on the data quality check editor screen shown below. The data quality check is activated by turning the green switch on the left to an ON position. The alerting thresholds for data quality issue severity levels are configured in the Warning threshold, Error threshold and Fatal threshold columns.
The following example shows a daily_row_count data quality check that measures the row count captured for each day. It is a daily monitoring check type. The table in this example stores a list of all known countries recognized by the United Nations. The last known row count was 249 rows (countries). The configuration of alerting rules are:
- raise a warning severity data quality issue when the row count (the number of countries) drops below 240
- raise an error severity data quality issue when the row count (the number of countries) drops below 100
- raise a fatal severity data quality issue when the table is empty, because the row count (the number of countries) is below 1
DQOps YAML files
Data quality checks are defined as YAML files that support code completion in code editors, such as Visual Studio Code.
Data quality check definitions can be stored in the source code repository, and versioned along with any other data
pipeline or machine learning code. The folder structure where DQOps stores those YAML files is called DQOps user home
and is documented in the configuring data quality checks article.
Below is an example of the YAML file showing a sample configuration of a profiling column data quality check profile_nulls_percent.
-
The node that contains configuration of checks. In this example, these are profiling checks defined at a column level.
-
The name of the check category. Check categories group similar checks.
-
The name of the configured check.
-
The warning severity rule configuration.
-
The error severity rule configuration.
-
The fatal severity rule configuration.
The spec section contains the details of the table, including the target schema and table name.
The columns section lists the columns in the table that has configured checks. In this example, the column named
target_column has a configured check profile_nulls_percent. This means that the sensor reads the percentage of null
values in target_column. If the percentage exceeds a certain threshold, an error, warning, or fatal message will
be raised.
The structure of the table configuration file is described in the configuring checks section.
Issue severity levels
Each data quality check supports setting the alerting thresholds at three severity levels: warning, error, and fatal. DQOps evaluates the sensor readout (the captured data quality metric, such as a percentage of null values) by three data quality rules, using different alerting thresholds configured as rule parameters. If multiple rules at different severity levels identify a data quality issue (the rule fails), DQOps picks the severity level of the most severe rule that failed in the following order: fatal, error, and warning.
The rule severity levels are described below.
Warning
The warning level alerting threshold raises warnings for less important data quality issues, usually anomalies or expected random or seasonal data quality issues. Warnings are not treated as data quality issues. Data quality checks that have not passed the warning alerting rule, but have passed the error and fatal alerting rules, are still counted as passed data quality checks and do not reduce the data quality KPIs score. Warnings should be used to identify potential data quality issues that should be monitored, but the data producer should not take accountability for them.
For example, a percentage of data quality check monitoring null value may raise a warning when the percentage of rows with a null value exceeds 1% of all rows.
Error
The error is the default alerting level for monitoring checks, comparable to the "error" level in logging libraries. Data quality checks that failed to pass the rule evaluation at the "error" severity level are considered failed data quality checks for the purpose of calculating the data quality KPI score.
For example, a percentage of data quality check monitoring null value may raise an error when the percentage of rows with a null value exceeds 5% of all rows.
Fatal
The fatal severity level is the highest alerting threshold that should only be used to identify severe data quality issues. These issues should result in stopping data pipelines before the issue spreads throughout the system. Fatal data quality issues are treated as failed data quality checks and reduce the data quality KPIs score. The fatal threshold should be used with caution. It is mainly useful when the data pipeline can trigger the data quality check assessment and wait for the result. If any data quality check raises a fatal data quality issue, the data pipeline should be stopped.
For example, a percentage of data quality check monitoring null value may raise a fatal alert when the percentage of rows with a null value exceeds 30% of all rows.
Rule severity matrix
The purpose of reporting data quality issues at different severity levels is summarized below.
| Alerting threshold | Data quality check passed | Data quality KPI result is decreased | Data pipeline should be stopped |
|---|---|---|---|
| Warning | |||
| Error (default) | |||
| Fatal |
Types of checks
In DQOps, data quality checks are divided into 3 types.
Profiling checks
Profiling checks are designed to assess the initial data quality score of a data source. Profiling checks are also useful for exploring and experimenting with various types of checks and determining the most suitable ones for regular data quality monitoring.
Monitoring checks
Monitoring checks are standard checks that monitor the data quality of a table or column. They can also be referred to as Data Observability checks. These checks capture a single data quality result for the entire table or column. There are two categories of monitoring checks: daily checks and monthly checks.
-
Daily monitoring checks capture the end-of-day data quality status of the monitored table or column. When they are run again during the day, the daily checks store only the most recent data quality status for that day.
-
Monthly monitoring checks capture the end-of-month data quality status of the monitored table or column. When they are run again during the month, they store only the most recent status for the current month, overwriting the previous data quality status from the previous evaluation during the current month.
Partition checks
Partition checks are designed to measure the data quality of partitioned data. In contrast to monitoring checks, partition checks capture a separate data quality result for each partition. To run a partition check, you need to select a column that serves as the time partitioning key for the data. Partition checks are also divided into two categories: daily checks and monthly checks. Partition checks are designed for incremental data quality monitoring.
Define custom check in DQOps user interface
You can easily change the rules and sensor associated with the checks in DQOps using the Configuration section of the user interface.
Check definition screen
Below is an example of the Configuration screen for the daily_row_count check.
This screen is responsible for editing the specification files for a custom data quality check
stored in the $DQO_USER_HOME/checks/**/*.dqocheck.yaml files.

What's next
- Learn how to configure data sources
- Learn how to configure data quality checks
- Learn how to run data quality checks
- Learn more about profiling checks
- Learn more about monitoring checks
- Learn more about partition checks
- Review the list of common data quality problems detected by DQOps, divided into categories of data quality checks