Last updated: April 09, 2024
How to configure data quality checks and rules
Read this guide to learn how to configure data quality checks in DQOps in YAML files, and how to set up the validation rules.
Where are the data quality checks configured?
Data quality checks are configured on monitored tables and columns in
the <schema_name>.<table_name>.dqotable.yaml YAML files.
These files are placed in the $DQO_USER_HOME/sources/<connection_name>/ folders
in the DQOps user home.
The role and layout of the DQOps user home folder are described on the DQOps user home page.
Read the configuration of data sources to know how to add data sources. The concept of the table metadata in DQOps describes how to manage the .dqotable.yaml table metadata files.
Configuring data quality checks from the DQOps user interface
Follow the running data quality checks manual to see how to use the user interface to configure the data quality checks.
YAML file structure
The following example of a table metadata file shows the location of data quality check nodes where the parameters for the table-level data quality checks and data quality rules are defined.
- The node where profiling checks are configured at a table level.
- The node where monitoring checks are configured at a table level.
- The node where daily monitoring checks are configured at a table level.
- The node where monthly monitoring checks are configured at a table level.
- The node where partition checks are configured at a table level.
- The node where daily partition checks are configured at a table level.
- The node where monthly partition checks are configured at a table level.
Table-level configuration elements
The nodes where the table-level data quality checks are configured in the .dqotable.yaml file are described in the table below.
Please expand this section to see the description of all .dqotable.yaml file nodes
| Line | Element path | Description | Default value |
|---|---|---|---|
| 11 | spec.profiling_checks |
The node where profiling checks are configured on a table level. | |
| 13 | spec.monitoring_checks |
The node where monitoring checks are configured at a table level. | |
| 14 | spec.monitoring_checks.daily |
The node daily monitoring checks are configured at a table level. | |
| 16 | spec.monitoring_checks.monthly |
The node monthly monitoring checks are configured at a table level. | |
| 18 | spec.partitioned_checks |
The node where partition checks are configured at a table level. | |
| 19 | spec.partitioned_checks.daily |
The node where daily partition checks are configured at a table level. | |
| 21 | spec.partitioned_checks.monthly |
The node where monthly partition checks are configured at a table level. |
Configuring table-level checks
The data quality checks can be configured both at a table level and at a column level, depending on the type of the check.
The configuration of data quality checks will be shown in the example of a profiling check.
Table-level profiling checks
The table profiling checks are meant to capture advanced data quality statistics and store the most current value for each month. Their role is to track the overall quality of data, without affecting the data quality KPIs.
The example below shows a configuration of the profile_row_count
with only a warning severity rule that verifies if the table's row count is at least one row.
A warning severity issue will be raised when a result of a query similar to SELECT COUNT(*) FROM <monitored_table>
will be 0, which means that the table is empty.
- The table profiling checks specification where the profiling checks are configured.
- A volume category node. Other categories are sibling nodes of the volume.
- The configuration of the profile_row_count data quality check.
- The configuration of a data quality rule at a warning severity level. This rule will raise a warning severity level data quality issue if the sensor readout does not meet the rule parameter.
- The rule parameter for the min_count rule. It is the smallest accepted row count (the sensor readout captured by the data quality check's sensor) that will make the rule pass.
- Another category node for the table schema checks.
The elements of the profiling checks configuration are listed in the table below.
| Line | Element path (within the spec node) |
Description |
|---|---|---|
| 6 | profiling_checks |
The table-level profiling checks container profiling checks specification where the profiling checks are configured. |
| 7 | profiling_checks.volume |
A volume category node. Similar data quality checks are grouped in categories. Other categories are sibling nodes of this node. |
| 8 | profiling_checks.volume. profile_row_count |
The configuration of the profile_row_count data quality check. When a node with the name of the data quality check is added to the category node,check becomes activated. |
| 9 | profiling_checks.volume. profile_row_count.warning |
The configuration of a data quality rule at a warning severity level. This rule will raise a warning severity level data quality issue if the sensor readout does not meet the rule parameter. |
| 10 | profiling_checks.volume. profile_row_count.warning.min_count |
The rule parameter for the min_count rule. It is the smallest accepted row count (the sensor readout captured by the data quality check's sensor) that will make the rule pass. |
| 11 | profiling_checks.schema |
Yet another check category node. |
Table-level monitoring checks
The monitoring checks are the primary type of data quality check used in DQOps for continuous monitoring of the data quality of the data source. The data quality issues raised by these checks are decreasing the data quality KPI.
The monitoring checks are configured in the spec.monitoring_checks node and are divided into daily and monthly monitoring checks.
The daily monitoring checks keep only the most current check result for the day when the check was executed. Running the same check
again on the same day overrides the previously stored value, but does not delete the results from past days. The same principle is
followed by the monthly monitoring check, which store only one value for each calendar month.
The following example shows a table YAML file with the row count check configured both at daily and monthly periods. Please notice that the names of the checks are different because all data quality check names are unique in DQOps.
The daily monitoring check variant is daily_row_count and the monthly monitoring check variant is monthly_row_count.
- The table monitoring checks specification where the monitoring checks are configured.
- The daily monitoring checks container.
- The configuration of the daily_row_count data quality check.
- The monthly monitoring checks container.
- The configuration of the monthly_row_count data quality check.
Table-level partition checks
Table-level partition checks allow analyzing even petabyte scale tables that are constantly growing because new data are appended to new partitions. Running data quality checks as queries on such big tables is time-consuming, and can generate high charges when the data is hosted in the cloud.
The partition checks require that the spec.timestamp_columns.partition_by_column field is set.
The value of this field is a column name that is used as a partitioning key. DQOps is not limited to analyzing tables
that are physically date partition. It is possible to select any date/datetime/timestamp column that
divides the data by date ranges. The partition checks will use a GROUP BY clause, grouping the data
by the selected partition_by_column column, enabling detection of data quality issues in time ranges.
This column should be a column of type date, datetime or timestamp. The actual column data types depend on the monitored database type. However, when the column is not a date type because it is a text column, DQOps supports configuring calculated columns in the table YAML metadata. The calculated columns are virtual columns that are defined as an SQL expression using the target data source-specific SQL grammar.
The configuration of partition checks is similar to the configuration of monitoring checks, they are also divided into daily and monthly partition checks.
- The column name in the table that is used as the date partitioning key. It will be used by the partition
checks to calculate the data quality results for daily and monthly time periods. The partitioning column in this example
is the column named
datefrom the tested table. - The number of recent days queried when running the daily partition checks.
- The number of recent months queried when running the monthly partition checks.
- The table partition checks specification where the partition(ed) checks are configured.
- The daily partition checks container.
- The configuration of the daily_partition_row_count data quality check.
- The monthly partition checks container.
- The configuration of the monthly_partition_row_count data quality check.
The incremental_time_window section configures how the incremental data quality check execution
works on partition data.
DQOps generates SQL queries from the Jinja2 sensor templates by adding a WHERE clause that applies a query filter
on the table, scanning only the last 7 days for daily checks or the data since the 1st day of the previous month for monthly checks.
The additional filter predicate is similar to the following SQL fragment.
WHERE analyzed_table."date" >= DATE_ADD(CURRENT_DATE(), INTERVAL -{{daily_partitioning_recent_days}} DAY)
Because the data may change during the day, the default configuration of incremental partition checks in DQOps
excludes today for daily checks and the current month from monthly checks.
The default values for the daily_partitioning_include_today and monthly_partitioning_include_current_month are false.
Read the concept of incremental data quality monitoring to learn why running partition data quality checks is superior for append-only tables, financial data, and very big tables.
Configure issue severity levels
The data quality checks in DQOps allow setting different rule thresholds for different data quality issue severity levels. There are three severity levels: warning, error, and fatal. The warning level notifies the user about a potential issue, the error level indicates that the issue should be resolved to maintain data quality KPI score, and the fatal level represents a serious issue that can cause the data pipeline to stop.
The following example shows how to set three different threshold levels for a row count check.
- The warning severity level rule.
- The error severity level rule.
- The fatal severity level rule.
It is worth mentioning that the thresholds for the warning, error, and fatal rules should be inclusive. In this example, the warning rule raises a warning severity data quality issue when the row count drops below 1000 rows. When the table has 999 rows, a warning will be raised, but the thresholds for the error and fatal severity issues are lower, so these rules will pass successfully.
Setting up a threshold for the warning severity rule below the threshold for the error severity rule by mistake will make the warning rule ineffective, raising only error severity issues.
Checks without rules
Data quality checks without any rules are a special case in DQOps. These checks will only capture the sensor result from the sensor and store it in both the sensor_readouts, and the check_results parquet tables.
The issue severity level for these checks will be always valid, storing the value 0 in the severity column
in the check_results parquet table.
Checks without any rules enabled will also not be included in the data quality KPI because their include_in_kpi
flag will be false. The flag include_in_sla will be also false.
Due to a limitation in the YAML format, a node without a value makes the YAML file invalid. However, every YAML supports JSON inclusions.
The following example shows how to activate a check without setting any rules by setting its value
to a JSON {} empty object.
Rules without parameters
Some data quality rules do not have any parameters (thresholds).
Configuring these rules uses the same YAML/JSON trick to set the value of the rule to a JSON {} object,
enabling the rule at the given severity level.
The following example shows the daily_column_count_changed check that compares the column count captured today with yesterday's (or any previous known row count), detecting if the number of columns on the table has changed recently. A warning severity issue is raised on the day the change in the number of columns is detected..
Checks with additional sensor parameters
Some data quality sensors are parametrized. The parameters are used in the SQL template and will be rendered in the SQL query that is generated from the sensor.
The following example shows how to use the
daily_text_found_in_set_percent
check that uses an expected_values parameter which is an array of strings that are the valid values expected in the column.
This check counts the percentage of rows that have one of the expected values stored in the country column.
- The value that is expected in the column.
The parameters node is present in every data quality check, but it is not saved to the .dqotable.yaml file
when no parameters are specified.
Referencing data dictionaries
Instead of entering the same set of expected values as a parameter to data quality checks that use lists of accepted values, it is possible to move the list of values to a data dictionary. Data dictionaries are CSV files stored in the DQOps user home/dictionaries folder.
The list of values in the expected_values parameter of the daily_text_found_in_set_percent data quality check
can be replaced by a token that references the dictionary file. The token format is ${dictionary://<dictionary_file_name>}.
It is advised to wrap the token value in double quotes as shown in the example below.
- Data dictionary expansion formula
"${dictionary://<dictionary_file_name>}"replaced by a list of dictionary entries when DQOps runs a data quality check.
A data quality check can reference multiple dictionaries in separate lines. DQOps aggregates all values from all dictionaries, adding also standalone values included in the list.
The definition of custom data dictionaries is described in the data dictionaries section of the DQOps user home folder concept.
Configuring column-level checks
The list of columns is stored in the spec.columns node in the .dqotable.yaml file.
The configuration of the column metadata is described
in the configuration of the data sources.
Column profiling checks
Profiling checks are configured on columns the same way as on tables. Only a different set of data quality checks is available because column-level checks must be executed on a column. The column name is included in the generated SQL query rendered from a sensor's template.
The following example shows column profiling checks configured on a column.
- The container of the column-level profiling checks.
- A profile_nulls_count check without any rules, the check will only capture the number of rows with a null value in the cumulative_confirmed column.
- A profile_nulls_percent check that measures a percentage of rows with null values, instead of returning the number of rows. The check is configured to raise a warning severity issue when any null rows were detected (the percentage of null values is above 0%). An error severity issue is raised when the percentage of rows with null values exceeds 1%.
- A profile_column_exists check that verifies that the column is present in the table by reading the metadata of the table.
- The expected_value rule parameter's value is 1, which means that DQOps requires that the column was found.
Column monitoring checks
Column-level monitoring checks are also configured in a very similar way.
The following example shows using the daily monitoring variants of the profiling checks shown in the previous example.
- The container of the column-level monitoring checks.
- The container of the daily monitoring checks.
When the scheduling is enabled, these checks will be executed daily, detecting if any rows with null values were identified (measuring the completeness of the cumulative_confirmed column). Also, DQOps will retrieve the table schema from the data source and verify if the column is still found in the table's metadata.
Column partition checks
Configuring column-level partition checks is also not different from configuring them on a table level.
The following example shows using the completeness checks on a partition level. Please also notice that there is no daily_partition_column_exists check, because schema checks can be measured only on a whole table level by the monitoring type of data quality check. Table schema drift checks cannot operate on partitions.
- The selection of the column that will be used for date partitioning in the GROUP BY SQL clause.
- The container of the column-level partition checks.
Additional configuration
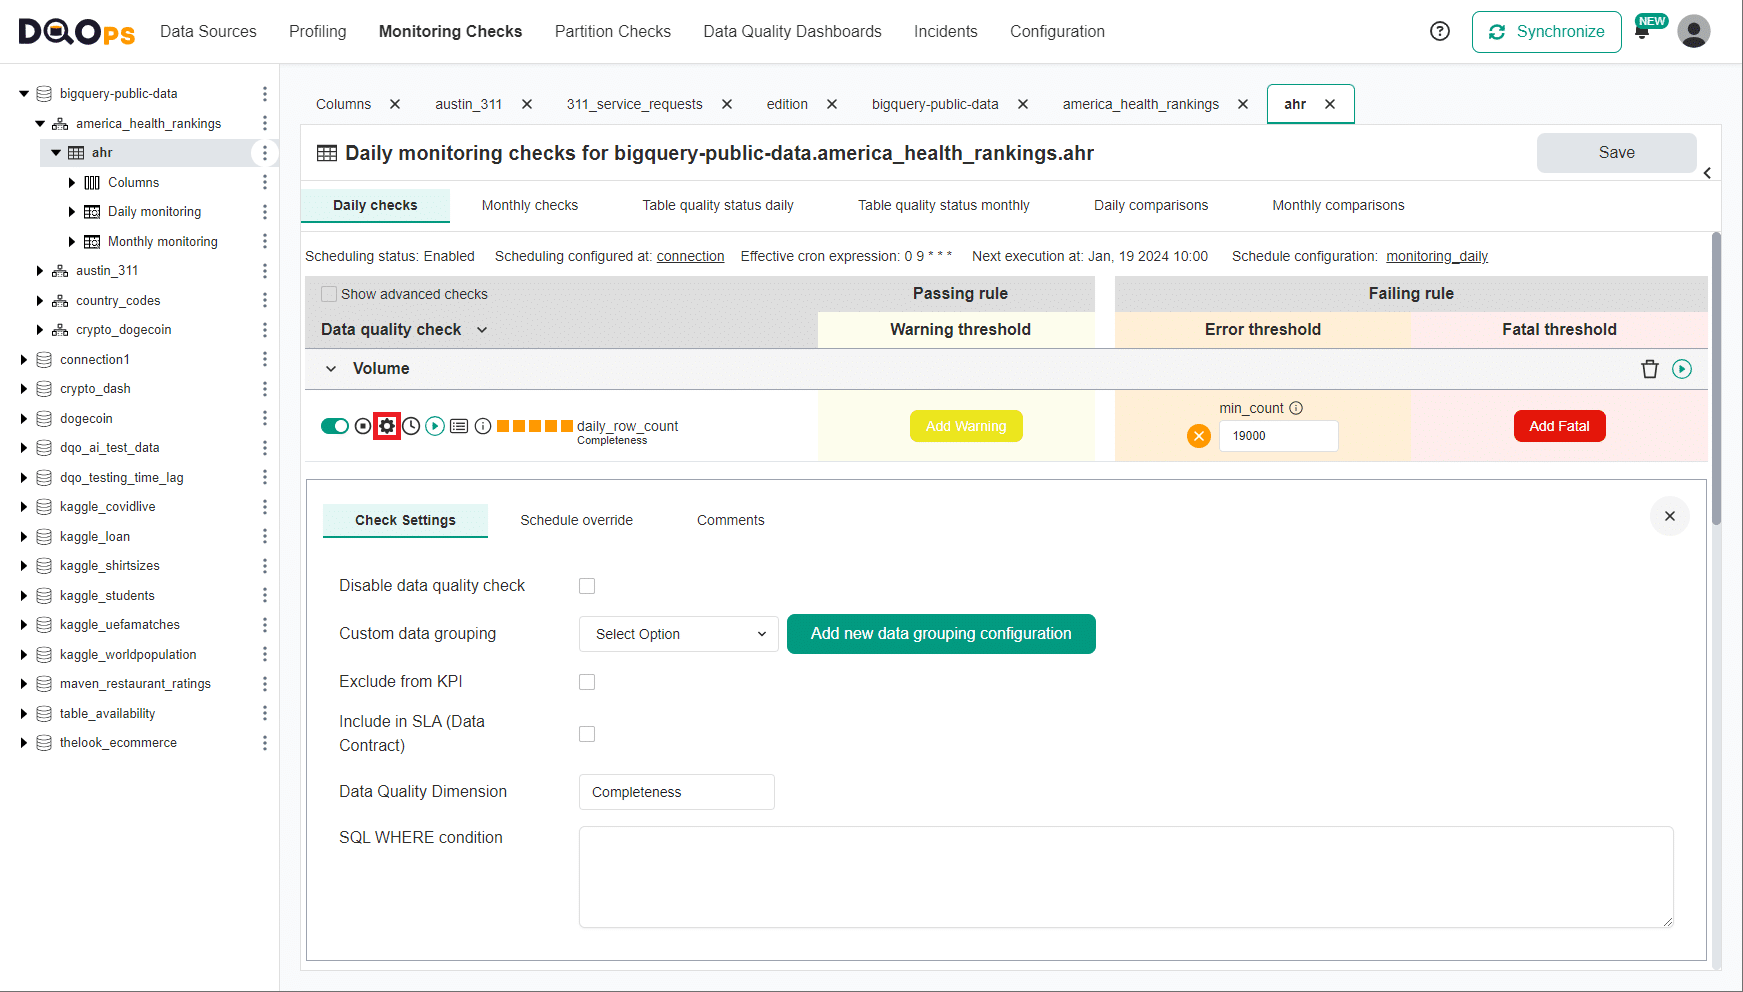
All data quality check nodes in .dqotable.yaml file also support adding additional configuration at a data quality check level.
The parameters for a single configured data quality checks are shown on the data quality check editor screen in the user interface after clicking the wheel icon.
Disable a data quality check
A data quality check can be disabled. A disabled data quality check is skipped when
running data quality checks, but the configuration is preserved in the
.dqotable.yaml file.
Change the data quality dimension
The data quality dimension name that is stored in the data quality parquet result files can be changed, if the default quality dimension name used internally by DQOps does not meet the data quality reporting requirements.
Change the display name
The data quality check name that is used on data quality dashboards can be also modified.
Instead of showing the technical name of the data quality check (daily_nulls_percent in this example),
a more user-friendly name "cumulative_confirmed has too many null values" will be shown.
Exclude from data quality KPI formula
Some data quality checks can be excluded from calculating the data quality KPI score.
Use a different data grouping
A data quality check can use a custom data grouping of data quality results, selecting a different data grouping name.
Custom run schedule
A single data quality check can use its own CRON schedule, instead of using the default schedule defined on the connection or table levels.
Exclude a check from the scheduling
A check can be excluded from scheduled execution when a CRON schedule triggers running all checks on a connection, or a table.
Applying table filters at a data quality check level
DQOps also supports setting a table filter predicate
at a data quality check level. The filter will affect only a single check, while all other
checks defined on the table will analyze the whole table or use the table-level filter. The filter predicate
is specified in the parameters.filter node inside the check's configuration as shown in the following example.
For further guidance on configuring checks, read the configuring data quality checks article.
Adding comments
You can also add custom comments to a configured data quality check. This feature becomes important if multiple users are maintaining data quality checks, and some changes to the check's thresholds are applied.
Activate multiple checks at once
DQOps supports also alternative methods of activating data quality checks, designed to configure thousands of checks at once, by turning on data quality checks using filters for target tables, columns, and the column's data type.
Activate multiple checks with the DQOps shell
The dqo check activate command supports activating multiple checks
from the DQOps shell.
Ready-to-use command examples for activating data quality checks are provided in the documentation of data quality checks.
The following example activates the daily_row_count check on
all fact tables, raising a warning severity issue when the table has less than 10000 rows.
The -Wrule_parameter_name= parameters support passing parameters to the data quality rules.
dqo> check activate -c=connection_name -t=public.fact_* -ch=daily_row_count --enable-warning -Wmin_count=10000
The next example activates the daily_nulls_percent check to measure that the columns that match the *_id name pattern contain only non-null values, counting the percentage of null values, and raising a data quality issue when the percentage is above 0%.
dqo> check activate -c=connection_name -t=public.fact_* -ch=daily_nulls_percent -col=*_id --enable-warning -Wmax_percent=0
Configuring data quality checks to raise error severity issues requires slightly different parameters, as shown in the example below.
dqo> check activate -c=connection_name -t=public.fact_* -ch=daily_nulls_percent -col=*_id --enable-error -Emax_percent=0
Configure multiple checks using the UI
DQOps provides the option to configure multiple checks from the user interface. You can search for target tables and columns to activate data quality checks or review the configuration of rules.

To learn more about configuring multiple data quality checks, refer to the manual.
What's next
- You haven't installed DQOps yet? Check the detailed guide on how to install DQOps using pip or run DQOps as a Docker container.
- DQOps has multiple built-in data quality dashboards for displaying data quality KPI. Learn more about different types of dashboards.
- DQOps allows you to keep track of the issues that arise during data quality monitoring and send alert notifications directly to Slack. Learn more about incidents and notifications.
- DQOps provide you with summary statistics about your table and column. This information can be valuable in deciding which data quality checks and threshold levels should be set to monitor data quality. For more details about Basic data statistics, click here.