Last updated: April 25, 2024
How to detect anomalies in numeric data
Read this guide to learn how to detect anomaly data quality issues in numeric data using DQOps.
The data quality checks are configured in the anomaly category in DQOps.
What is an anomaly in data
Anomalies in data are unexpected values outside the regular range.
We can detect two types of anomalies in numeric columns with a data quality platform such as DQOps. We can detect outliers, which are new minimum and maximum values, or we can detect if the typical values such as mean (average), median, or sum have changed.
Sample data for anomaly detection
We will use a latitude column in a 311 Austin municipal services call history table, which stores the latitude of the reported incident's location.
The following screen shows the data profiling summary captured by DQOps for the latitude column, showing the top 10 most common values.

We are expecting that the majority of service requests are reported in Austin, whose coordinates is 30°16′2″N 97°44′35″W. The city center is at 30°16′2″N, so the values in the latitude column should be around that value. Indeed, the profiling results show that the mean latitude is 30.28, which is 30° 16' 48"N, and it is not far away.
Data outliers
Data outliers are new minimum or maximum values outside the regular range.
New minimum
An invalid value is present that is far below the minimum value or the maximum value. We can detect such outliers by detecting that the minimum or maximum value in a column has changed since the last time data quality checks were run.
The column data statistics captured in the data profiling module show a minimum value of 3.44, which must be an invalid location for Austin. This value is a minimum value outlier that we can detect by the daily_min_anomaly analyzing the whole table by a monitoring data quality check, or by the daily_partition_min_anomaly when using partition checks to find an outstanding minimum value in each daily partition.
The following screen shows the result of detecting a minimum value for each daily partition. Around 30% of daily partitions had this outstanding minimum value. Given that approximately 30% of partitions have this minimum value, we cannot call it an outlier. If the value 3.44 is indeed an invalid value, it should be detected using the number_below_min_value data quality checks that find values below a minimum accepted value.
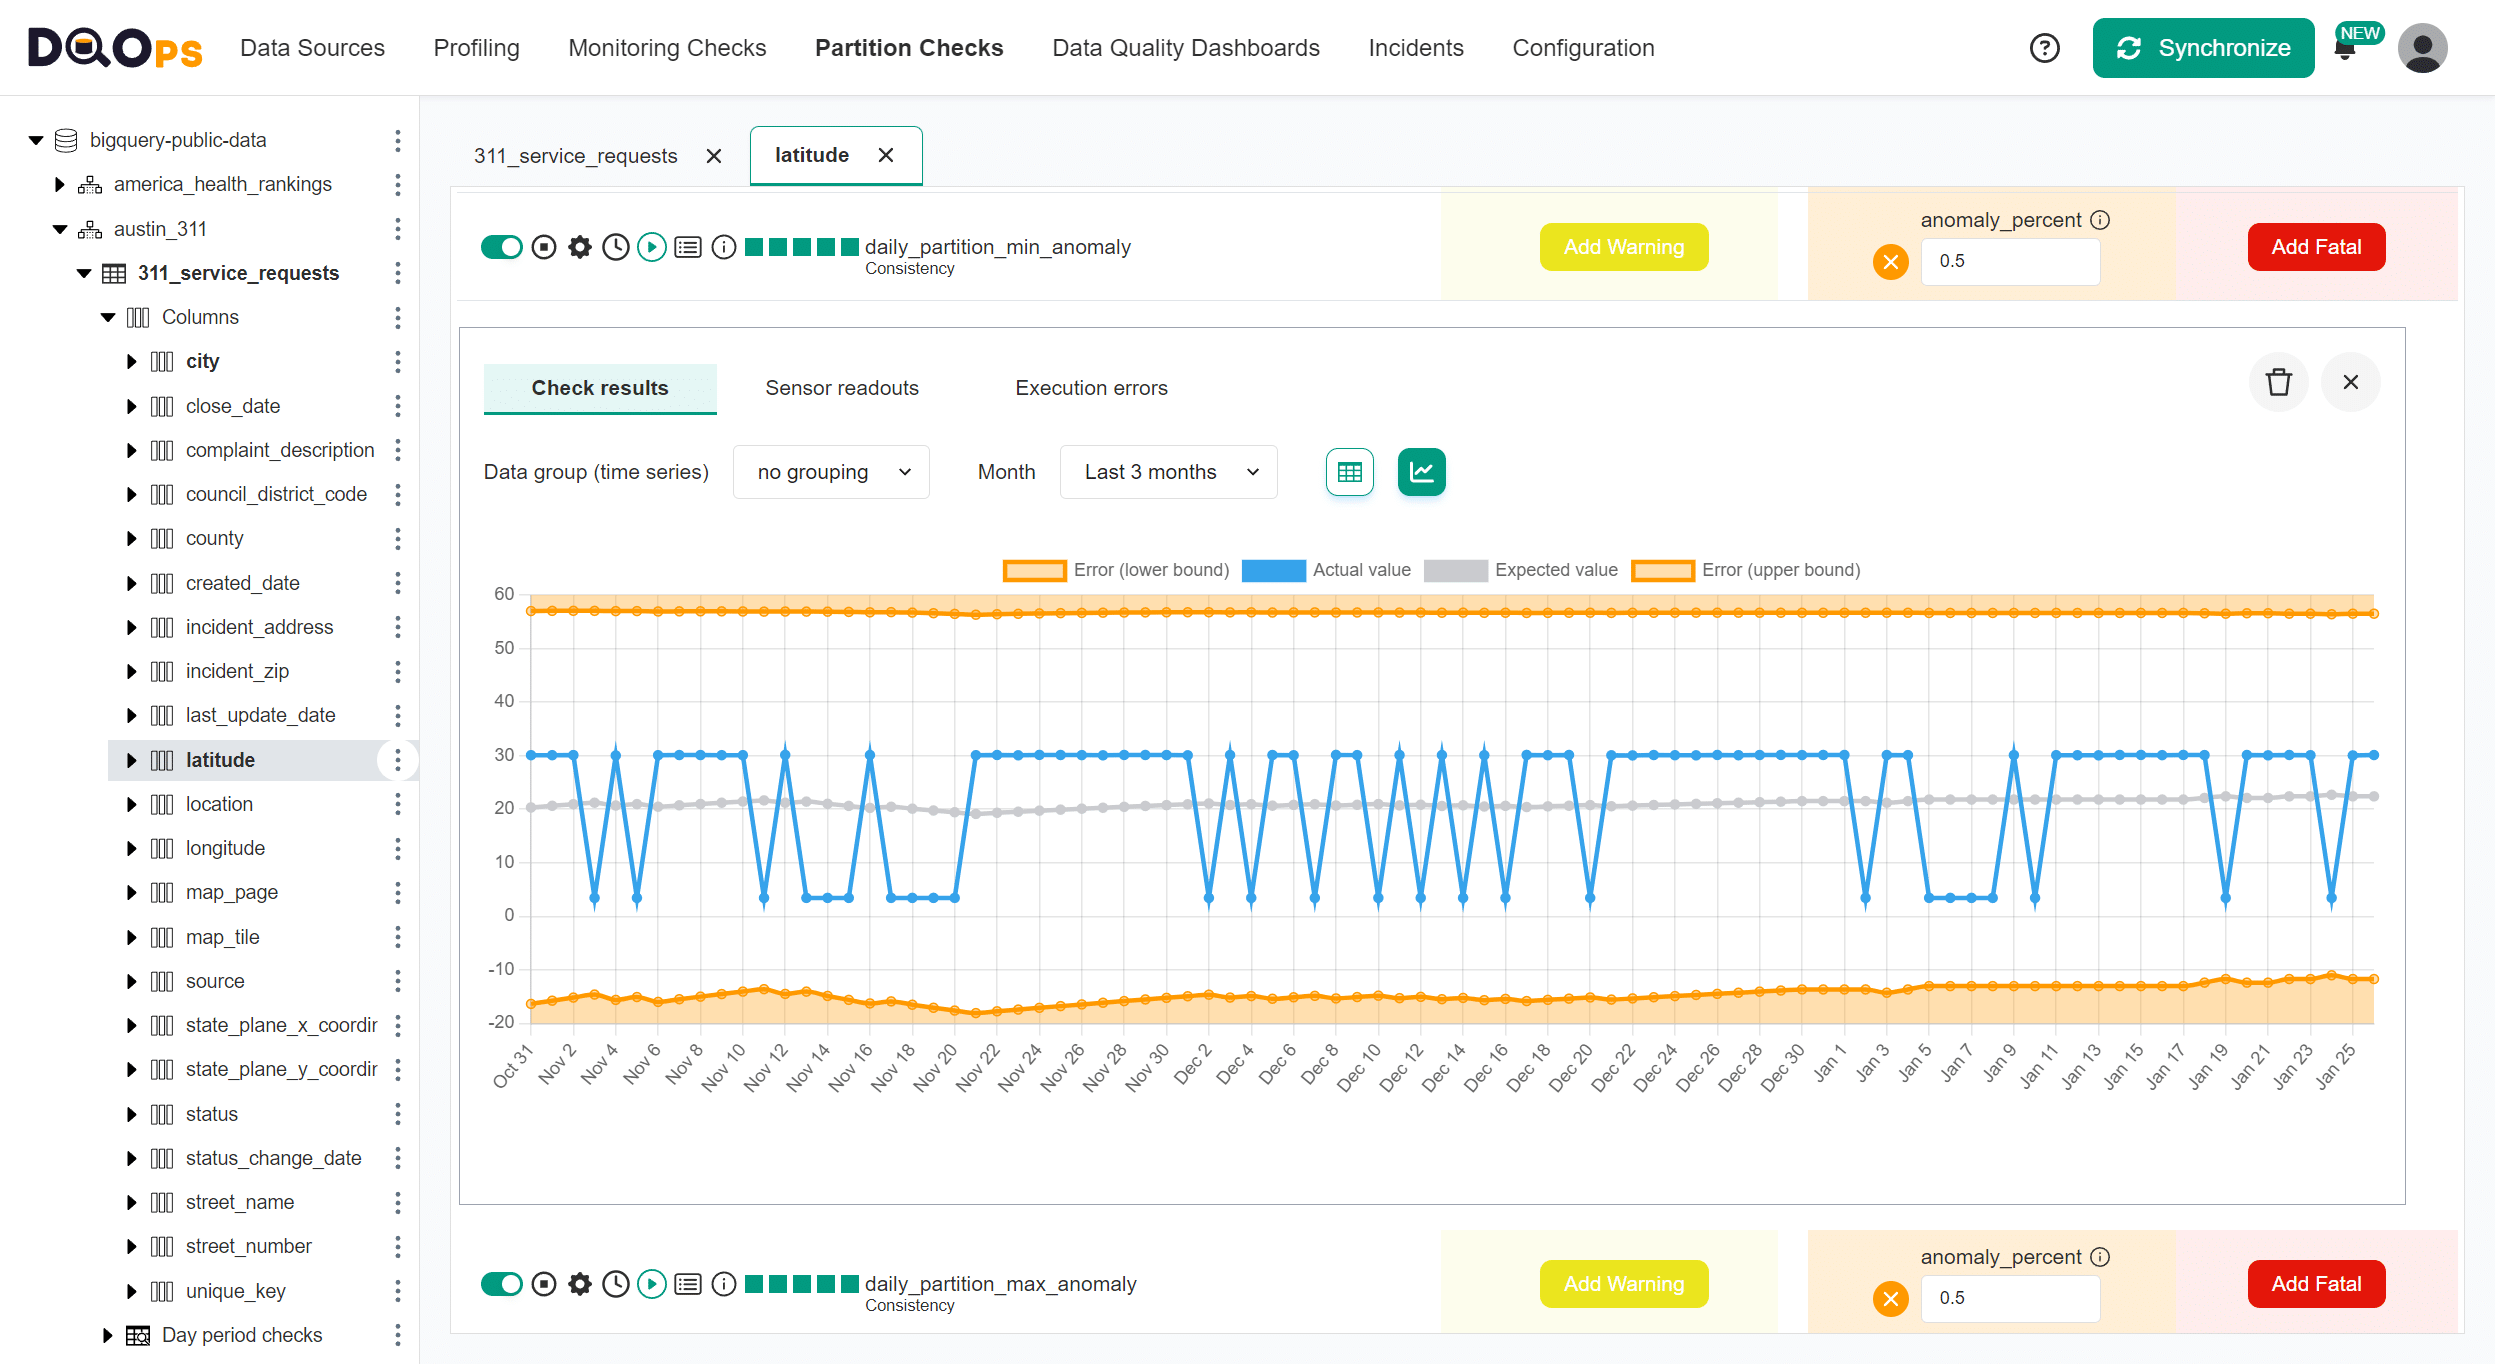
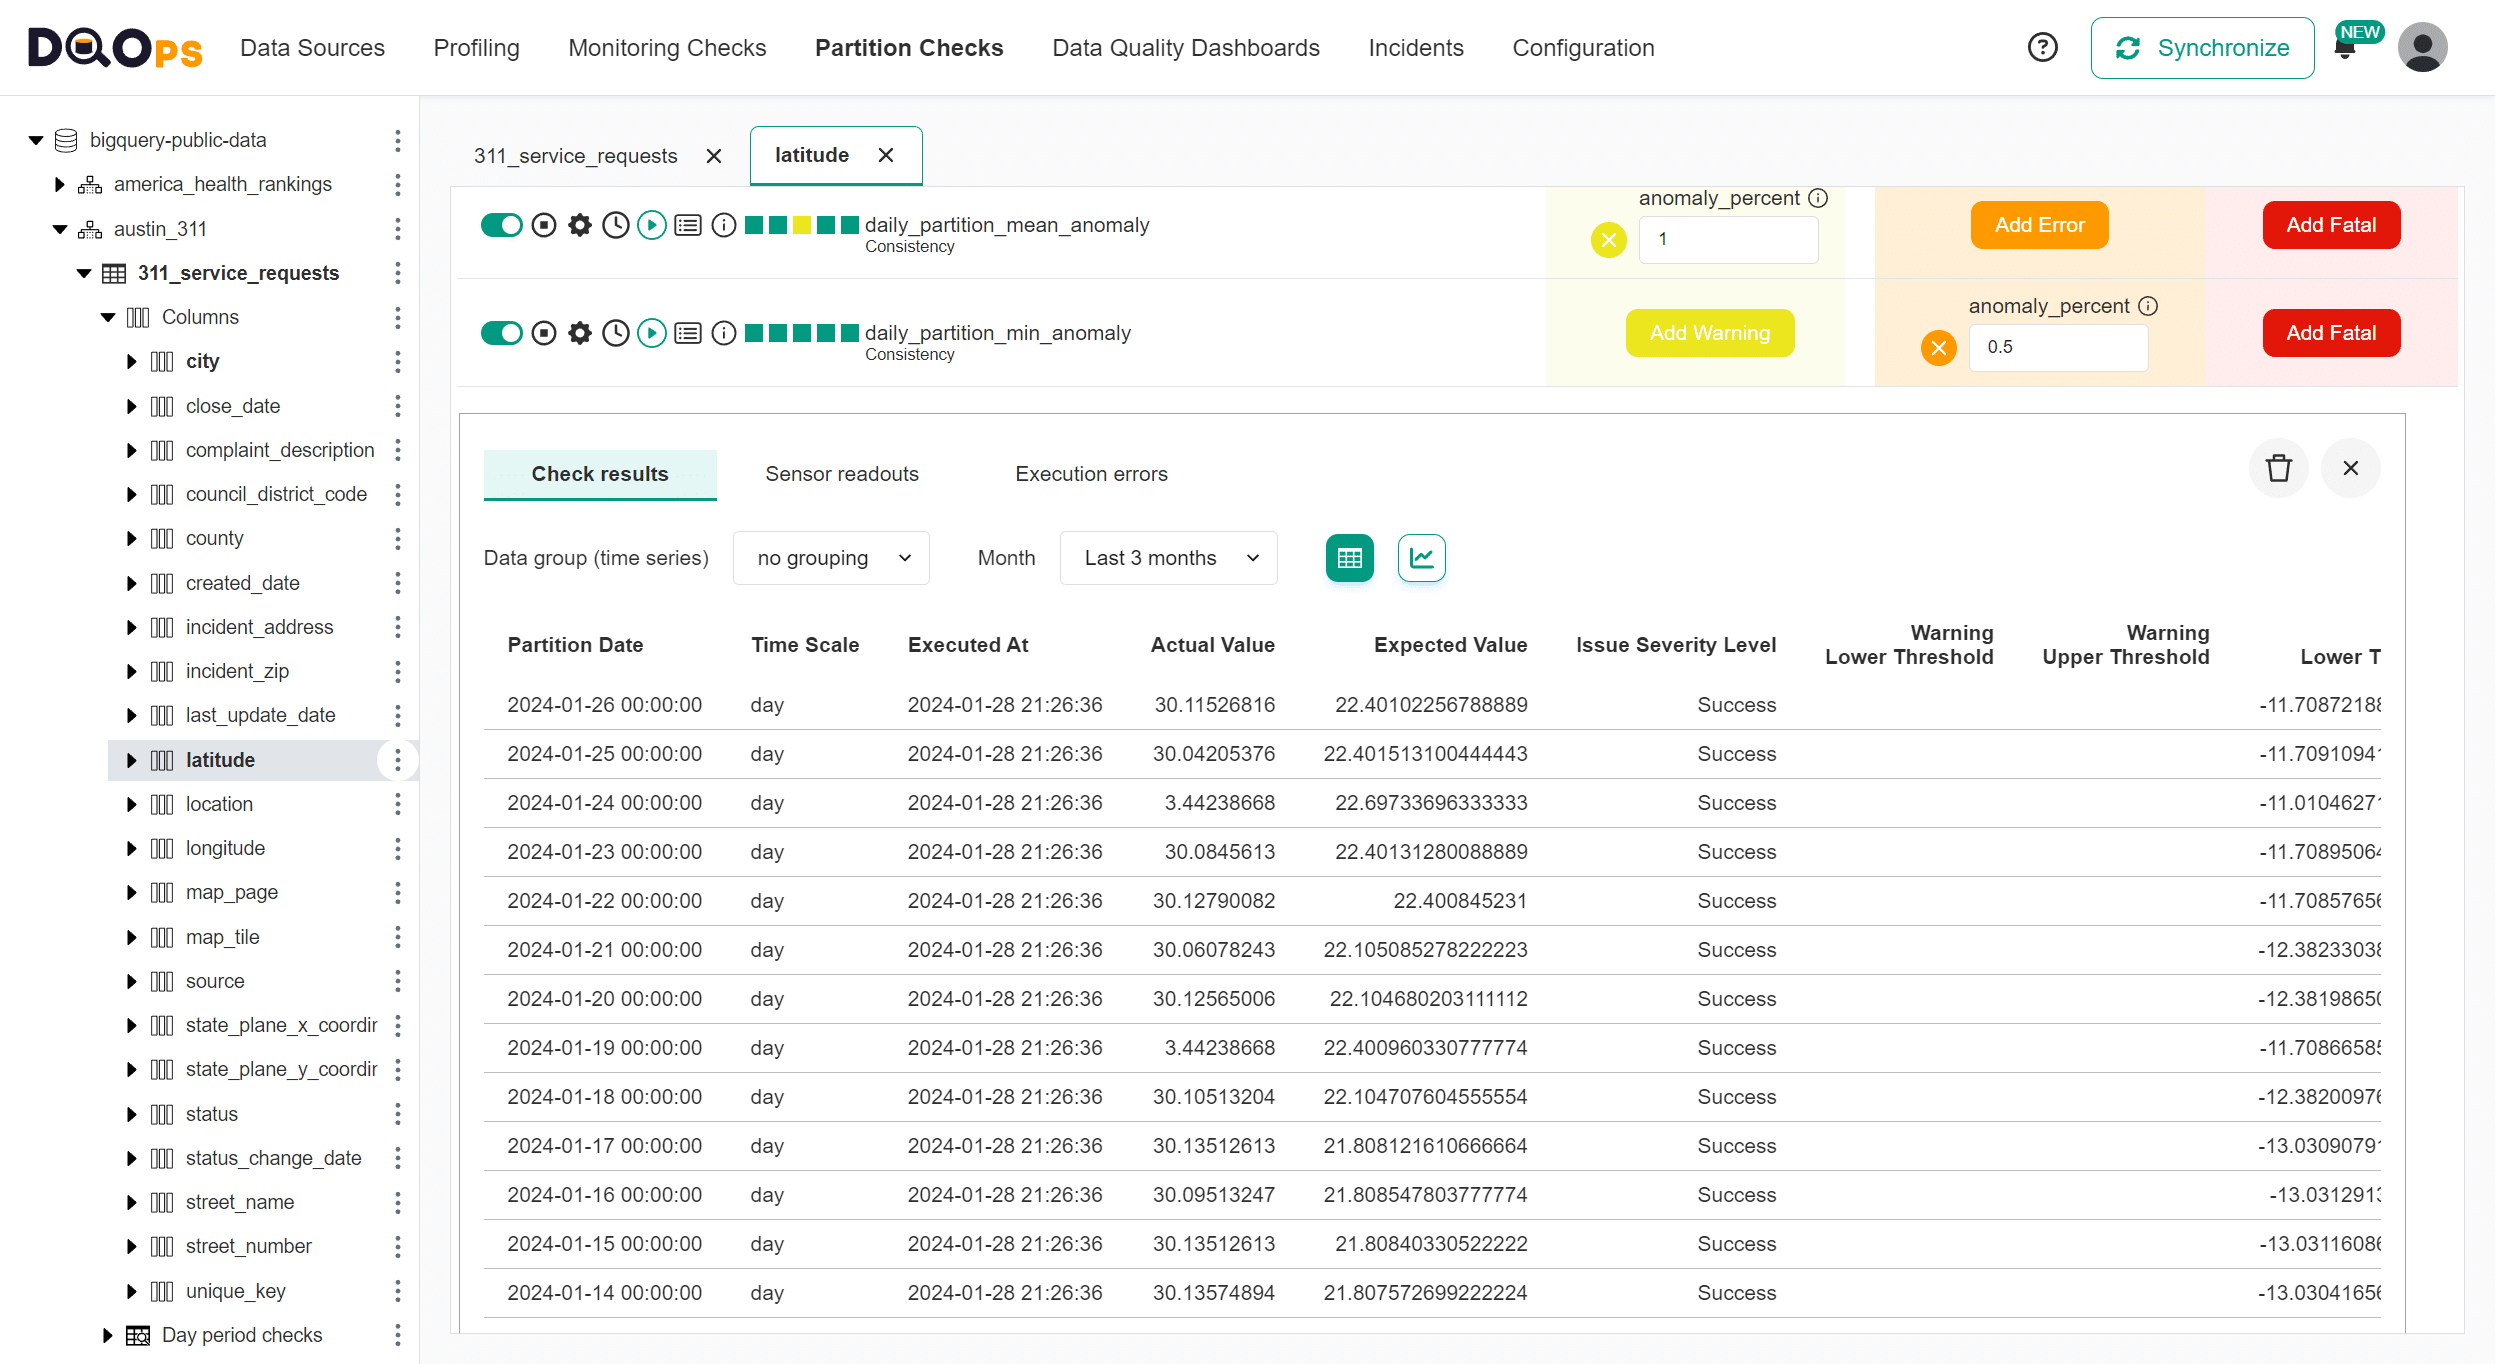
We can confirm that the minimum values in daily partitions are around 30.28 or 3.44 on the table with all data quality check results.
New maximum
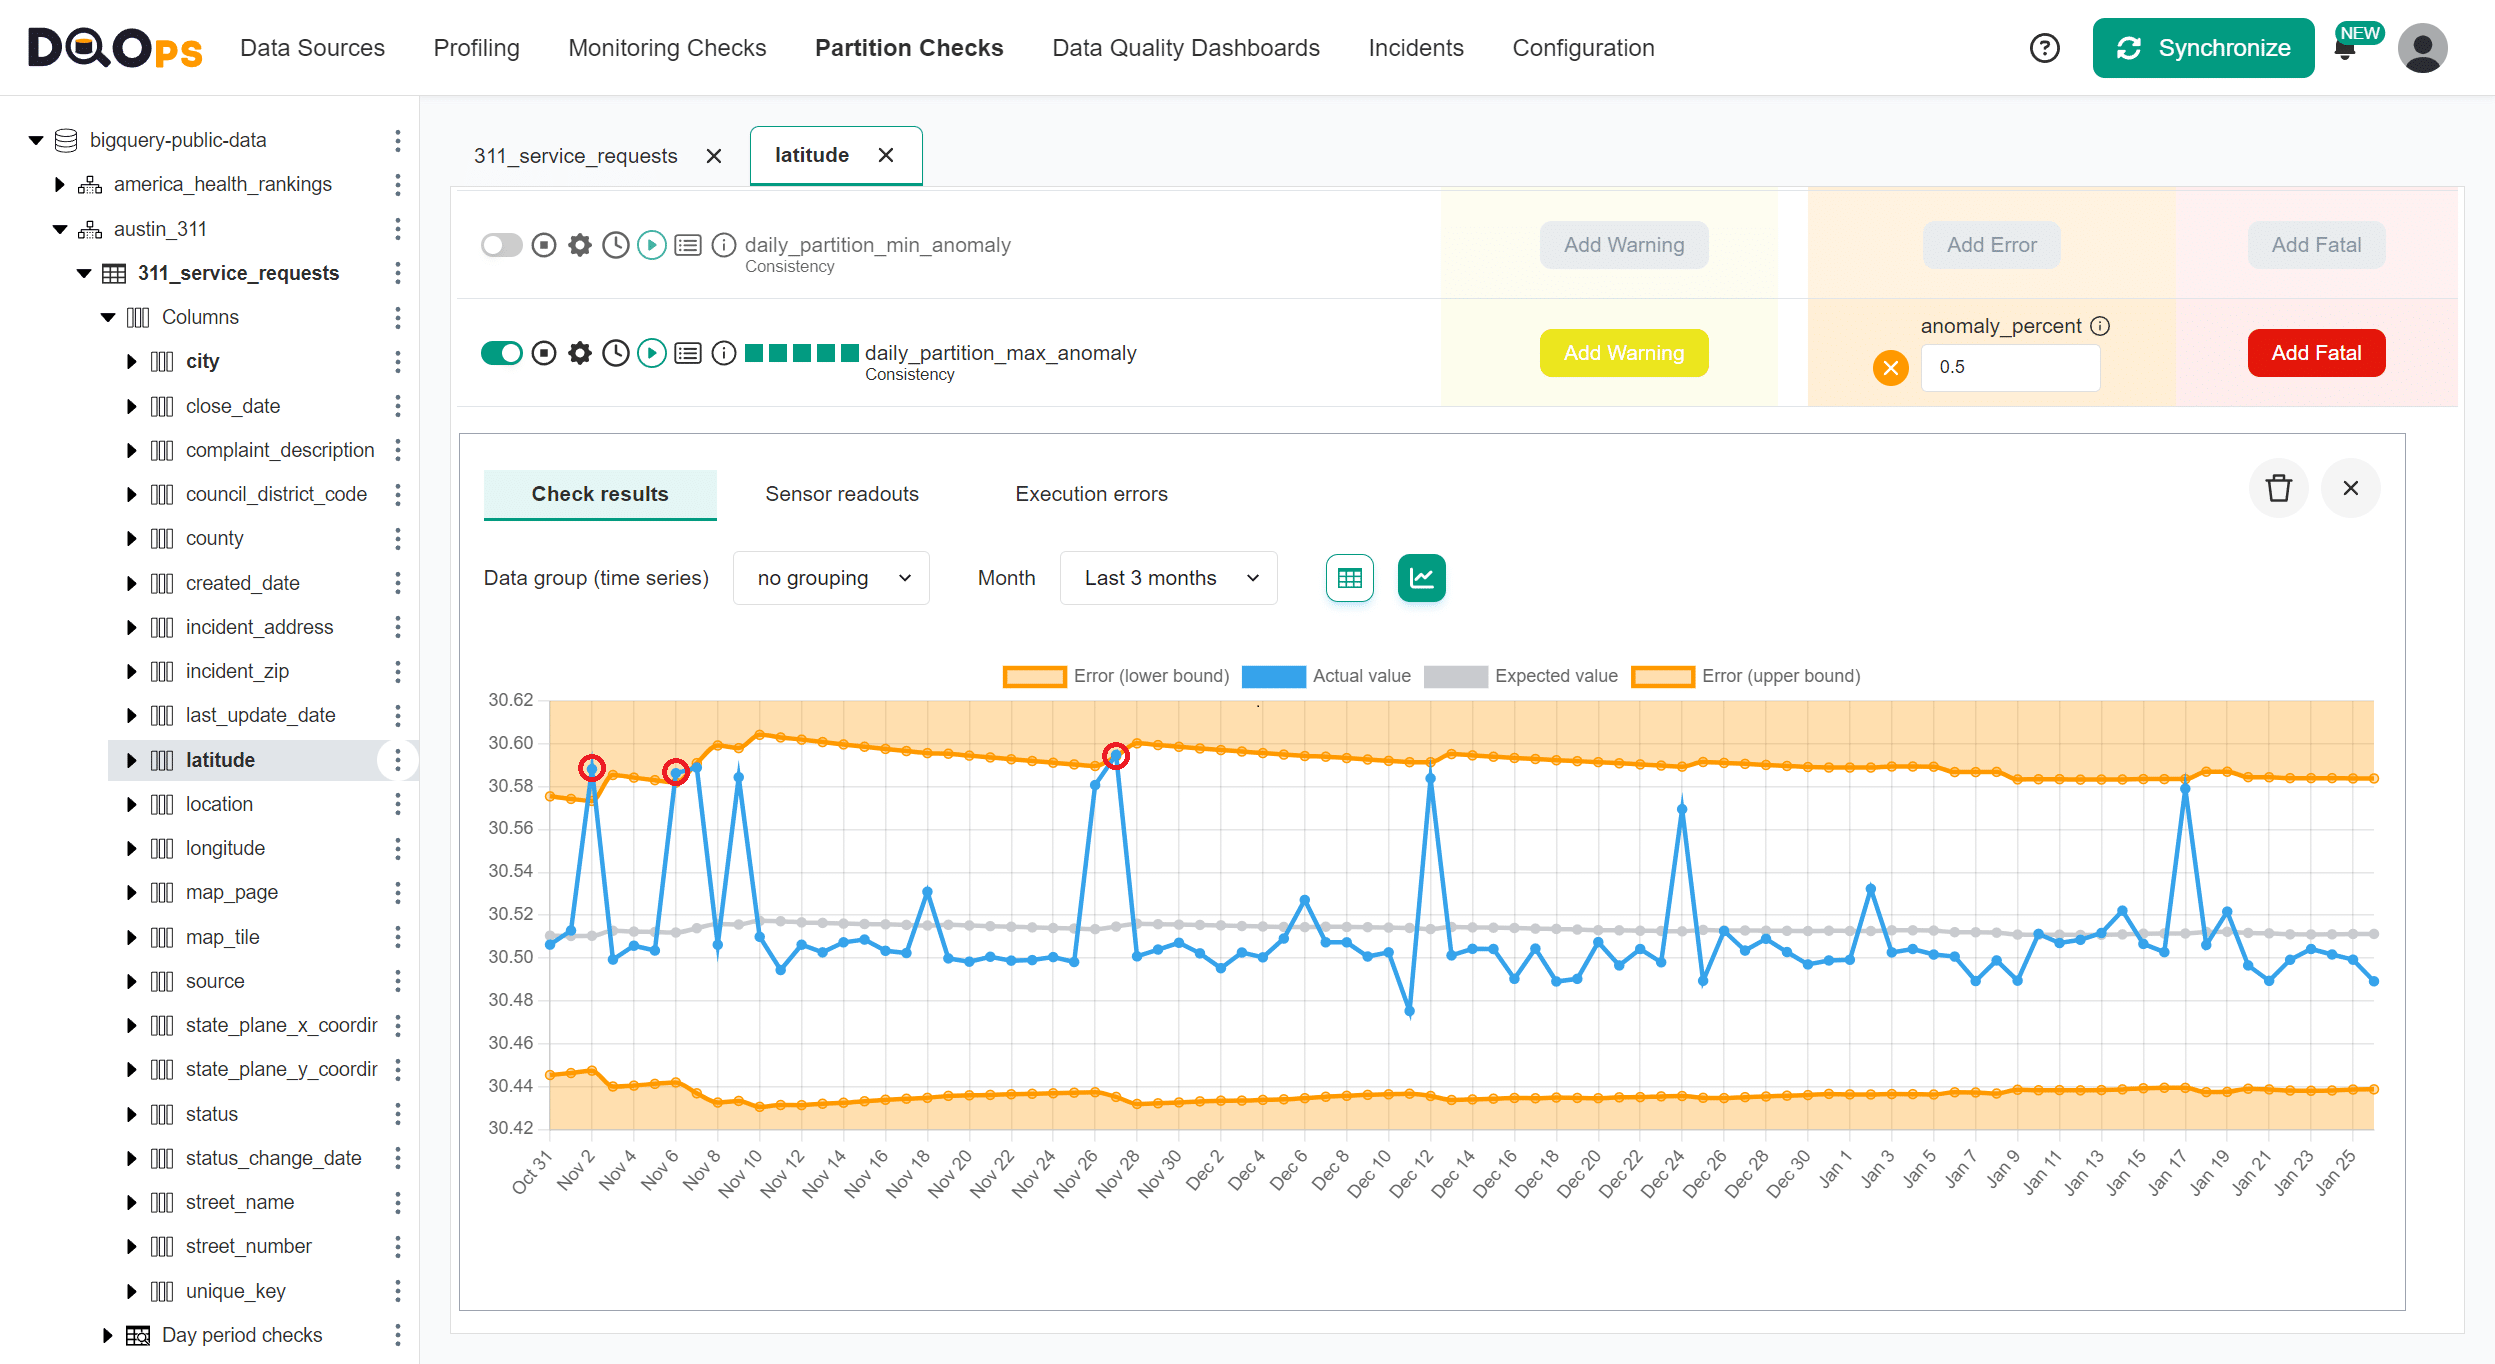
We can also detect abnormal maximum values. A similar daily_partition_max_anomaly data quality check detects new maximum values and compares them to other maximum values for earlier daily partitions. The chart shows three outliers of the maximum latitude (services outside the city area) found for the last three months.
Aggregate value changed
A significant change in an aggregate value, such as an average or sum of values, is another type of data anomaly.
Typical values out of range
Another type of anomaly is a shift of the typical value, such as the mean (average) value or a median value in the column. The mean and median values will change when we load many new values above or below the usual value (the old mean or median) into a table.
The following screen shows the mean (average) values of the latitude column calculated for each daily partition. We can interpret it as the average latitude of the location of the service request. An anomaly was detected on January 24th, 2024, highlighted with a yellow background on the table.

The chart view shows all anomalies of the maximum value in the latitude column.
Sum of values anomalies
We can also use a daily_partition_sum_anomaly to analyze a sum of all values for each daily partition. This type of numeric anomaly can detect missing or duplicate financial records. By activating the daily_partition_sum_anomaly data quality check on a table that stores a list of transactions or line items, we can calculate the total sum of all transactions daily.
Compare to a reference point
The data quality checks in DQOps identified by the _anomaly suffix use historical data to find outliers. They self-calibrate to the data.
Self-calibration is not a desired behavior because DQOps will detect false-positive outliers even for tiny measure changes.
DQOps supports another type of anomaly. DQOps can calculate a measure such as a sum, mean, and median daily or for every daily partition. Anomalies are detected by comparing the current aggregate value to a reference value at a given point in time. The data quality rule uses a fixed threshold and raises a data quality issue when the current metric differs more than X% from a past value.
The type of reference point is identified at the end of the name of the data quality check.
-
_changedata quality checks compare the value to any previous measure (data quality sensor readout), even if it is pretty old. -
_change_1_daydata quality checks compare the value with a value captured one day before. When theexact_dayboolean flag is false, the _change_1_day checks behave the same as the _change check and will find any previous measure to compare. -
_change_7_daysdata quality check compares the value with a value captured a week before. This type of check is designed for measures with seasonal dynamics in weekly periods. DQOps will compare Monday's result to Monday's result a week earlier. Tuesday's data is compared to past Tuesday's data. Theexact_dayparameter enforces comparison to a reference value that was captured seven days before. When the measure was not captured seven days ago, DQOps will not evaluate the data quality rule. -
_change_30_daysdata quality checks compare the value with a value captured thirty days ago. This type of check is designed for measures with seasonal dynamics in monthly periods.
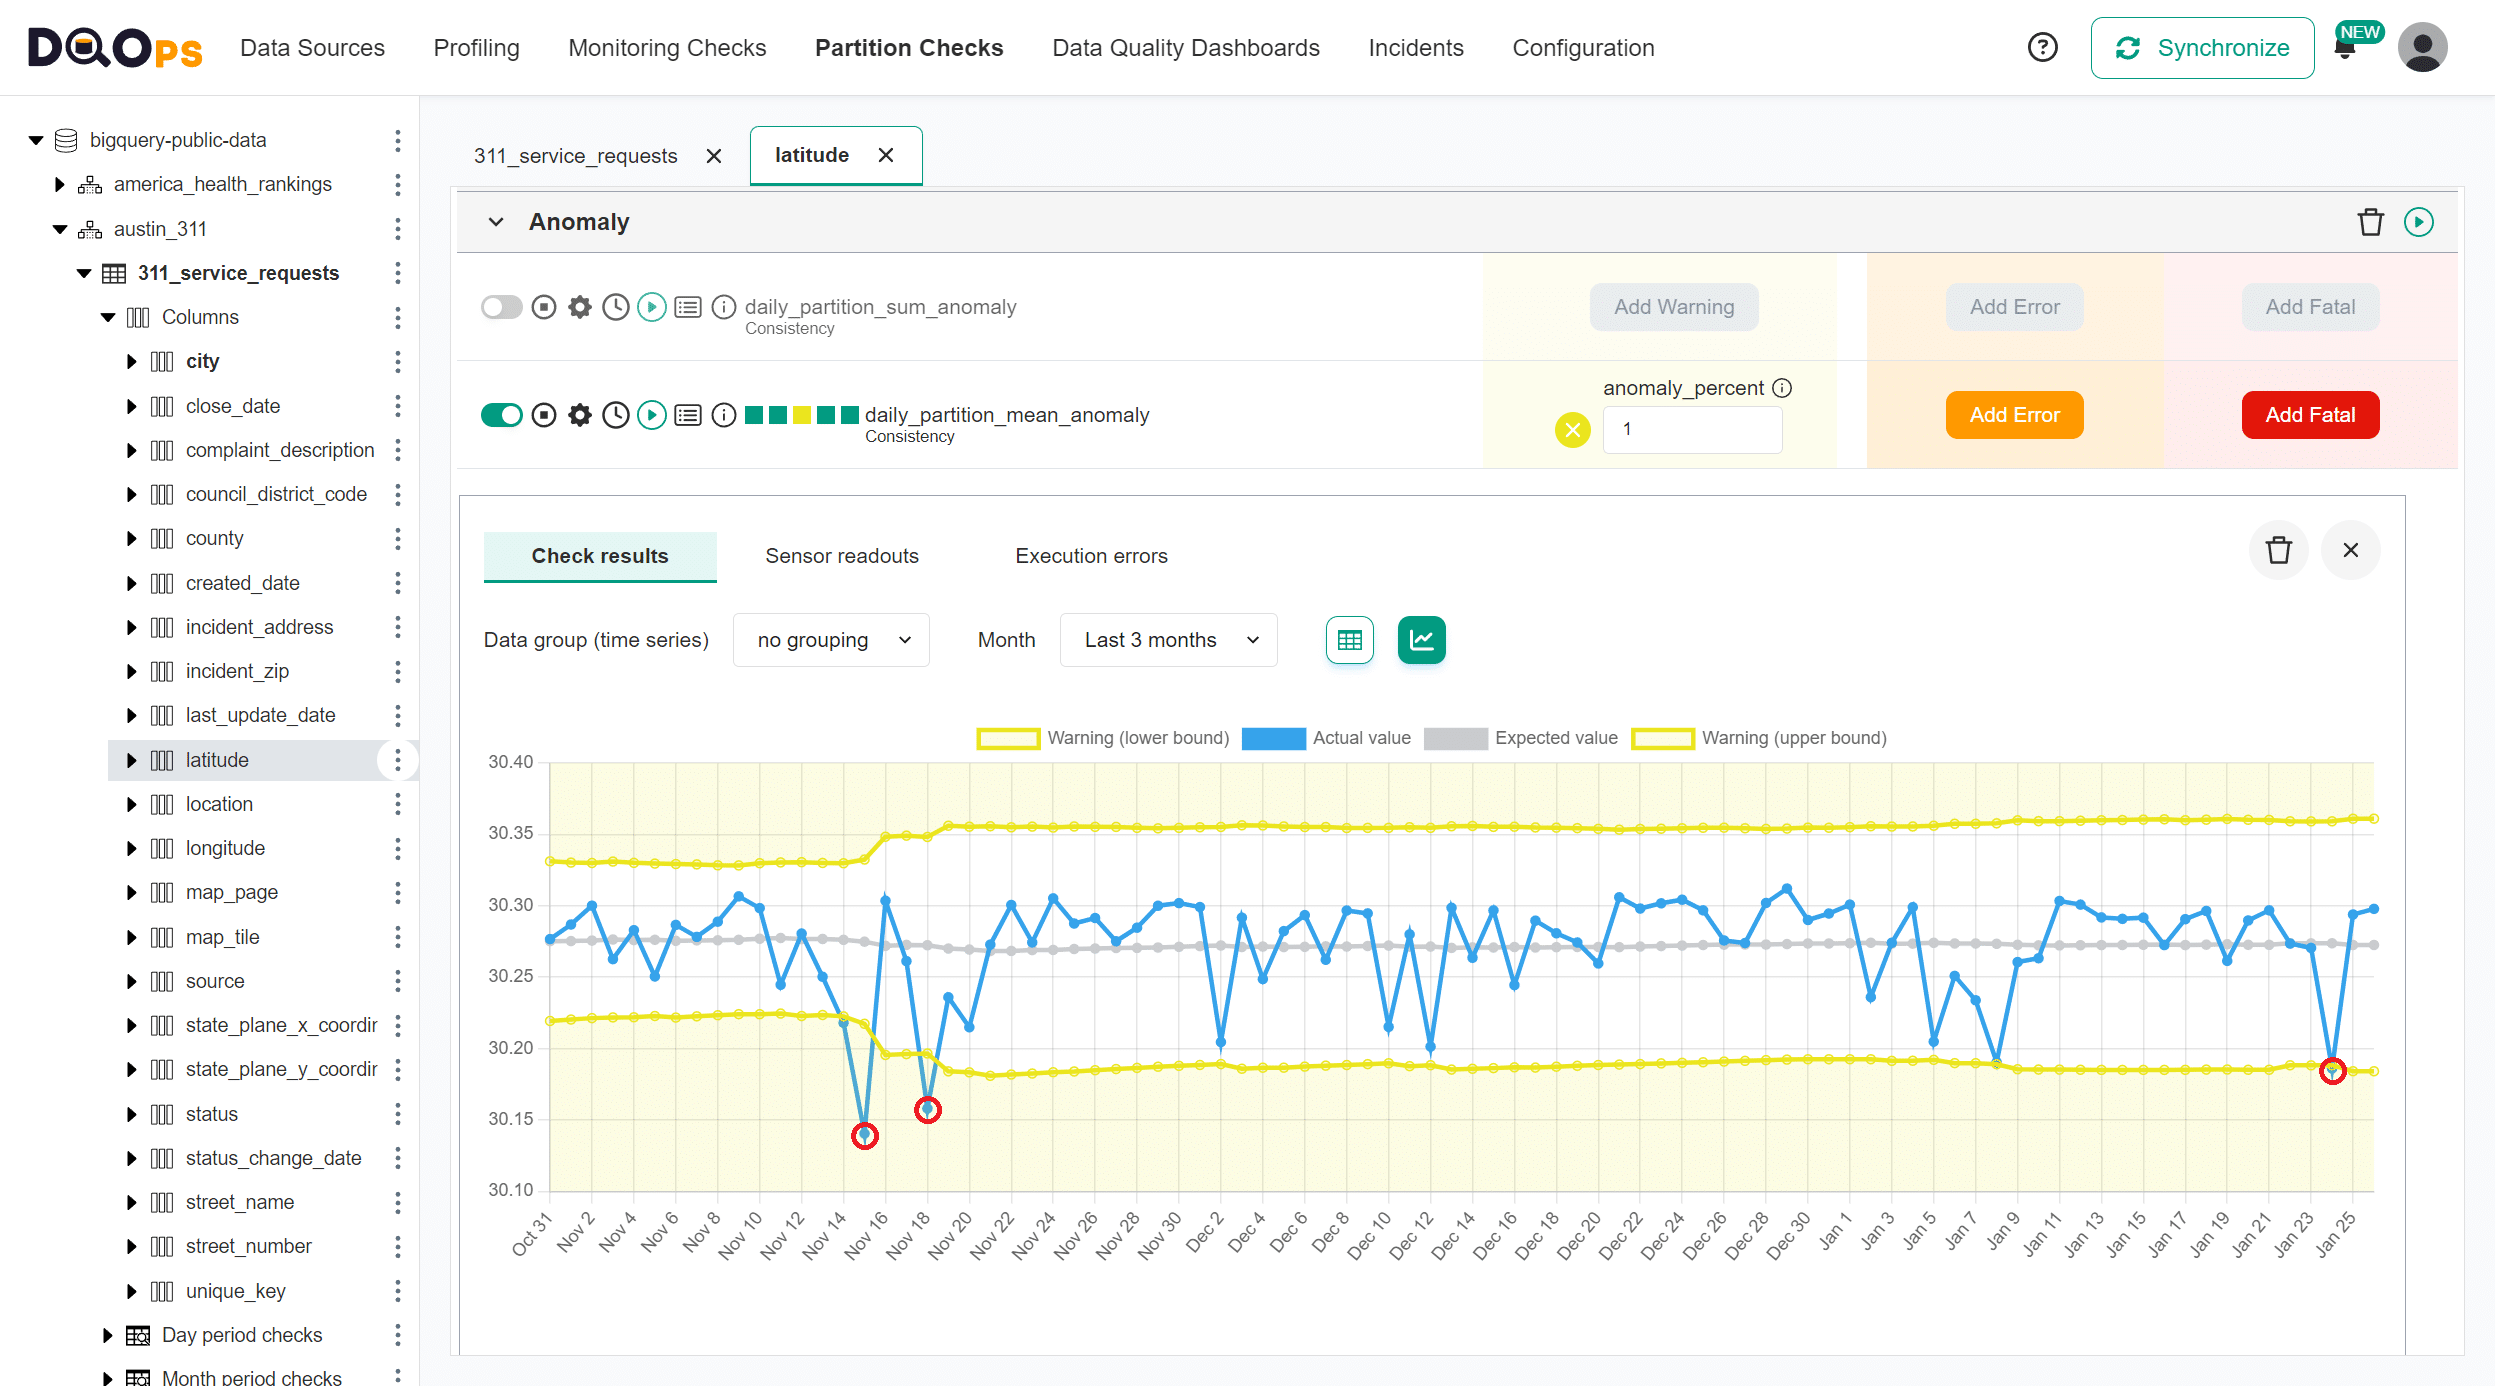
The following chart shows the changes in the mean value day-to-day. The daily_partition_mean_change_1_day data quality check captures a mean (average) value in every daily partition. DQOps identifies a data quality issue when the mean value difference since the last day is more than 1 percent.
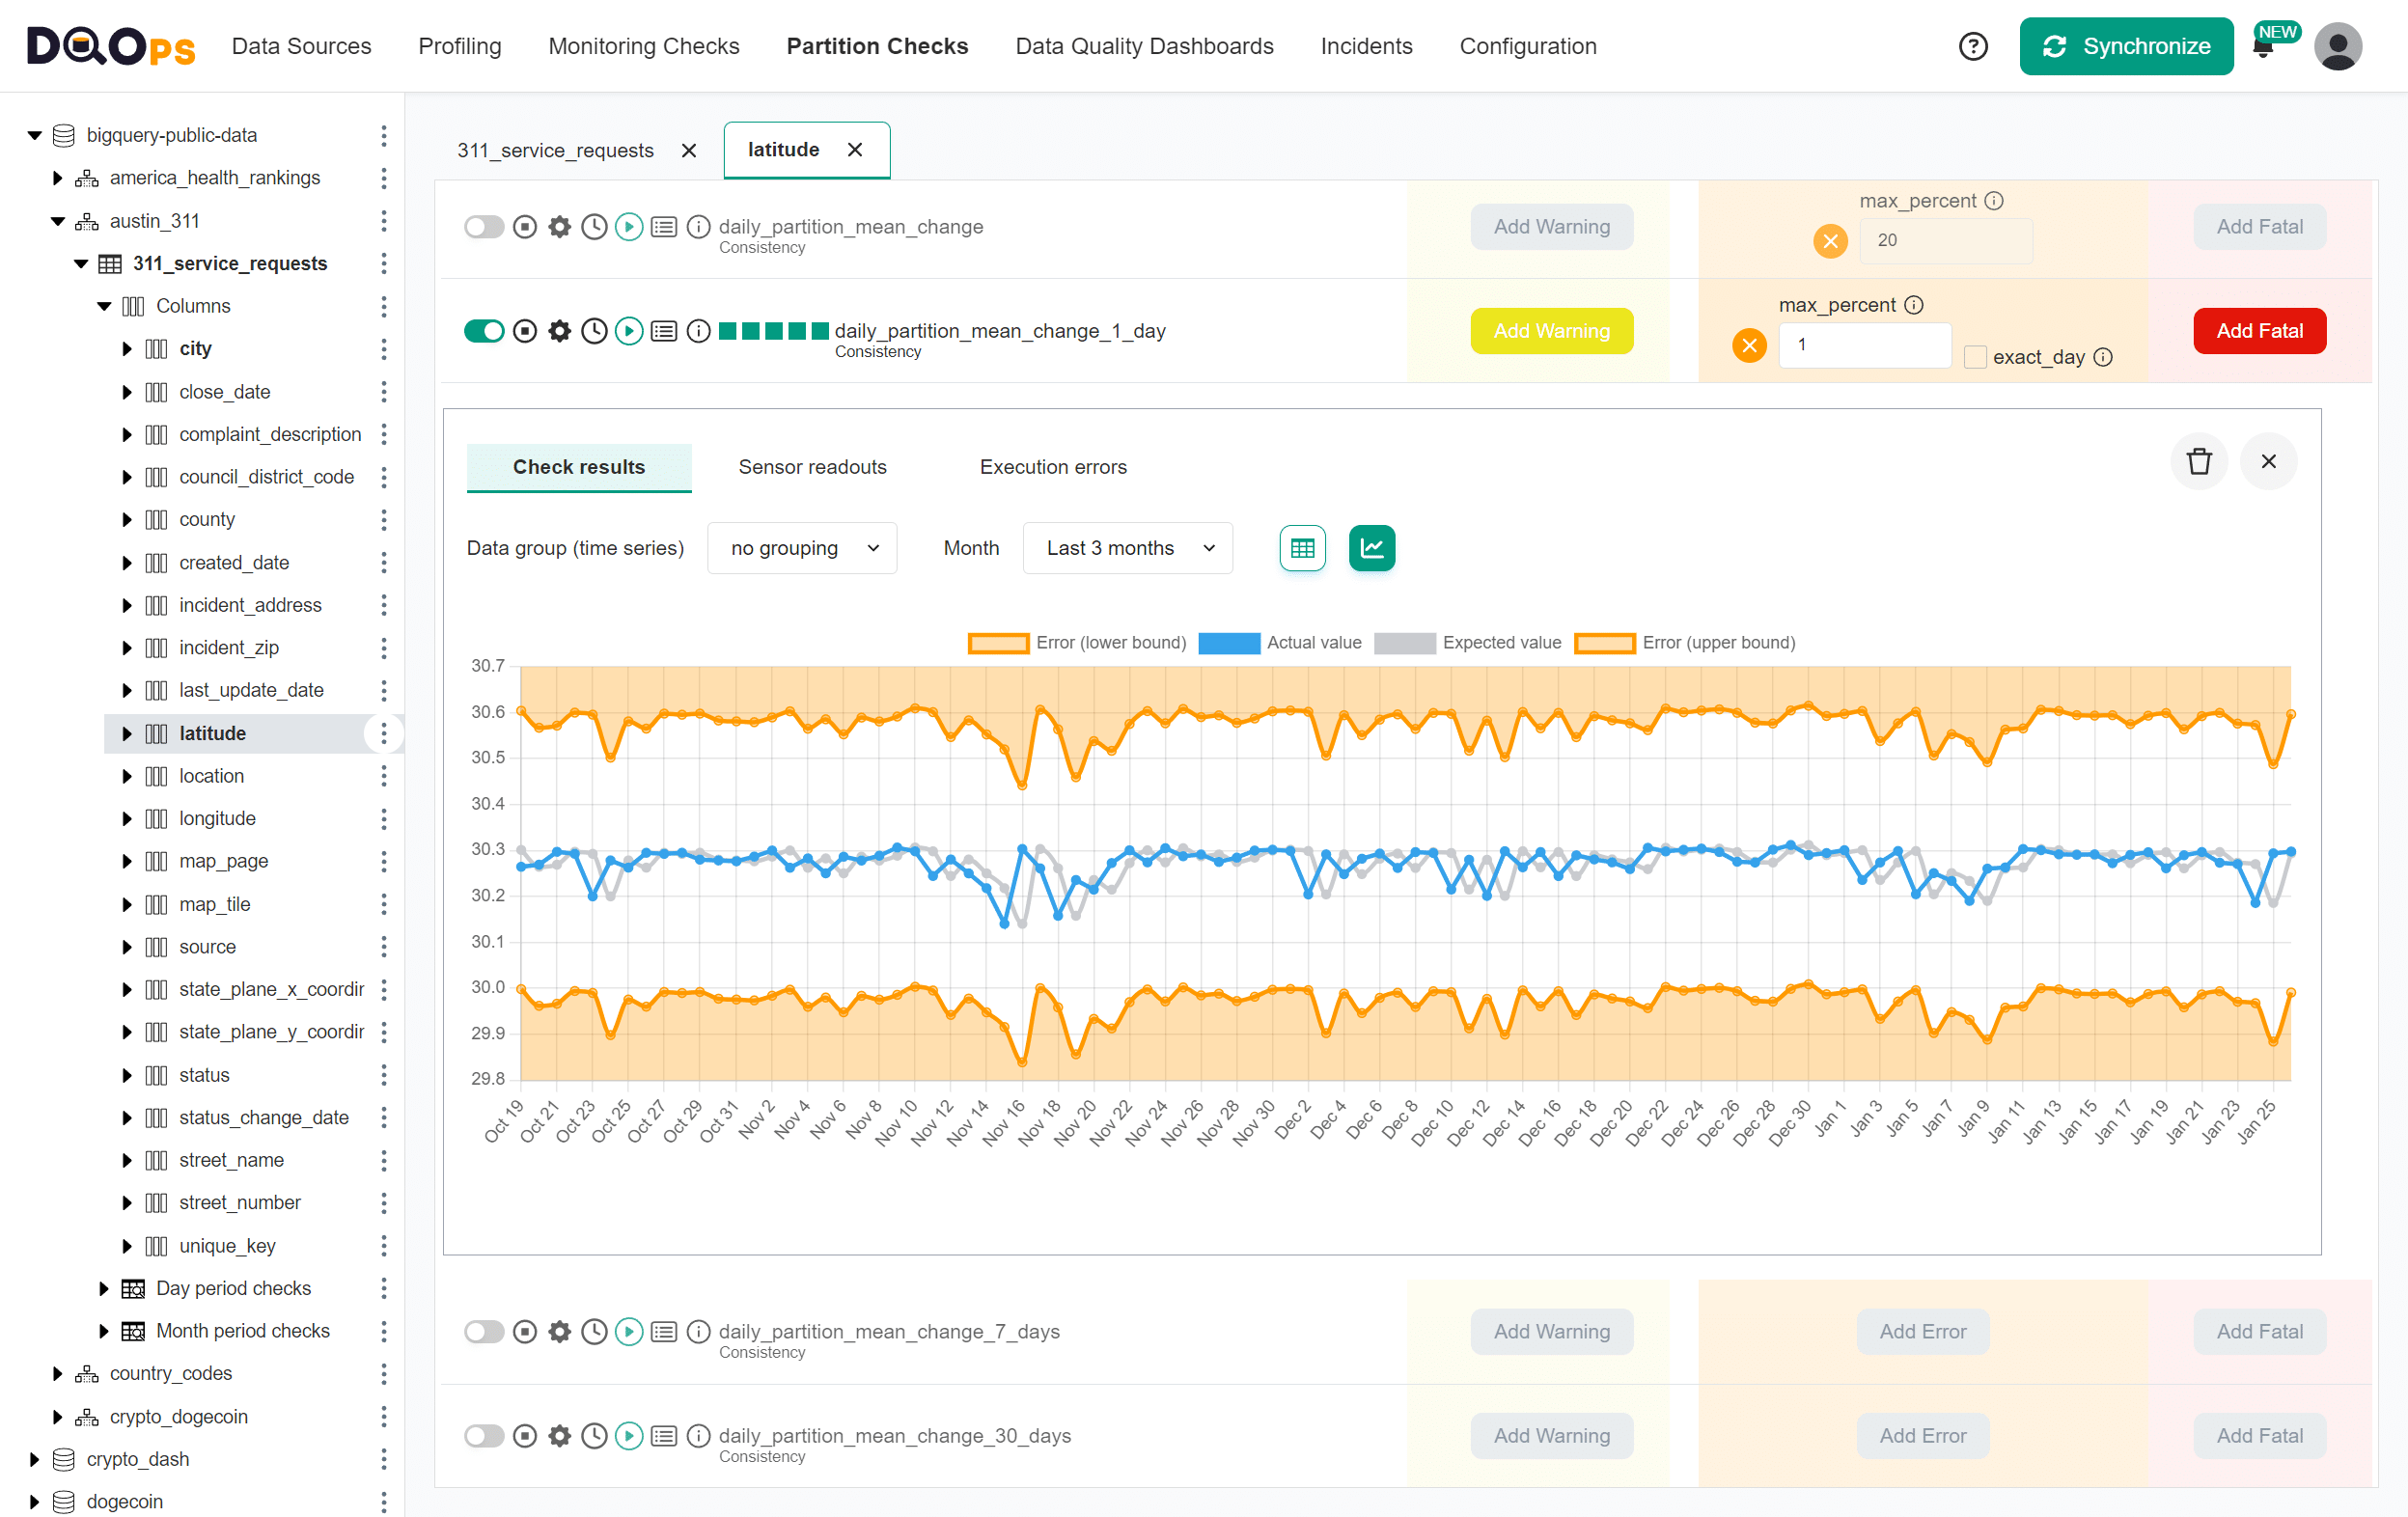
The blue line shows the current value of the mean measure. The gray line is the reference value, called the "expected value". The two lines are shifted by one day because DQOps compares values to a measure from the previous day.
The shift of the expected values by seven days is also visible on the chart of the daily_partition_mean_change_7_days data quality check.

Anomalies at multiple severity levels
DQOps supports configuration of the data quality rules for a data quality check at three issue severity levels: warning, error, and fatal. Each severity level has its own threshold value.
DQOps analyzes the measure (the mean value for this example) using three data quality rules, passing different parameters to the rule. Because the historical data is limited to ninety days, and the measures do not fit
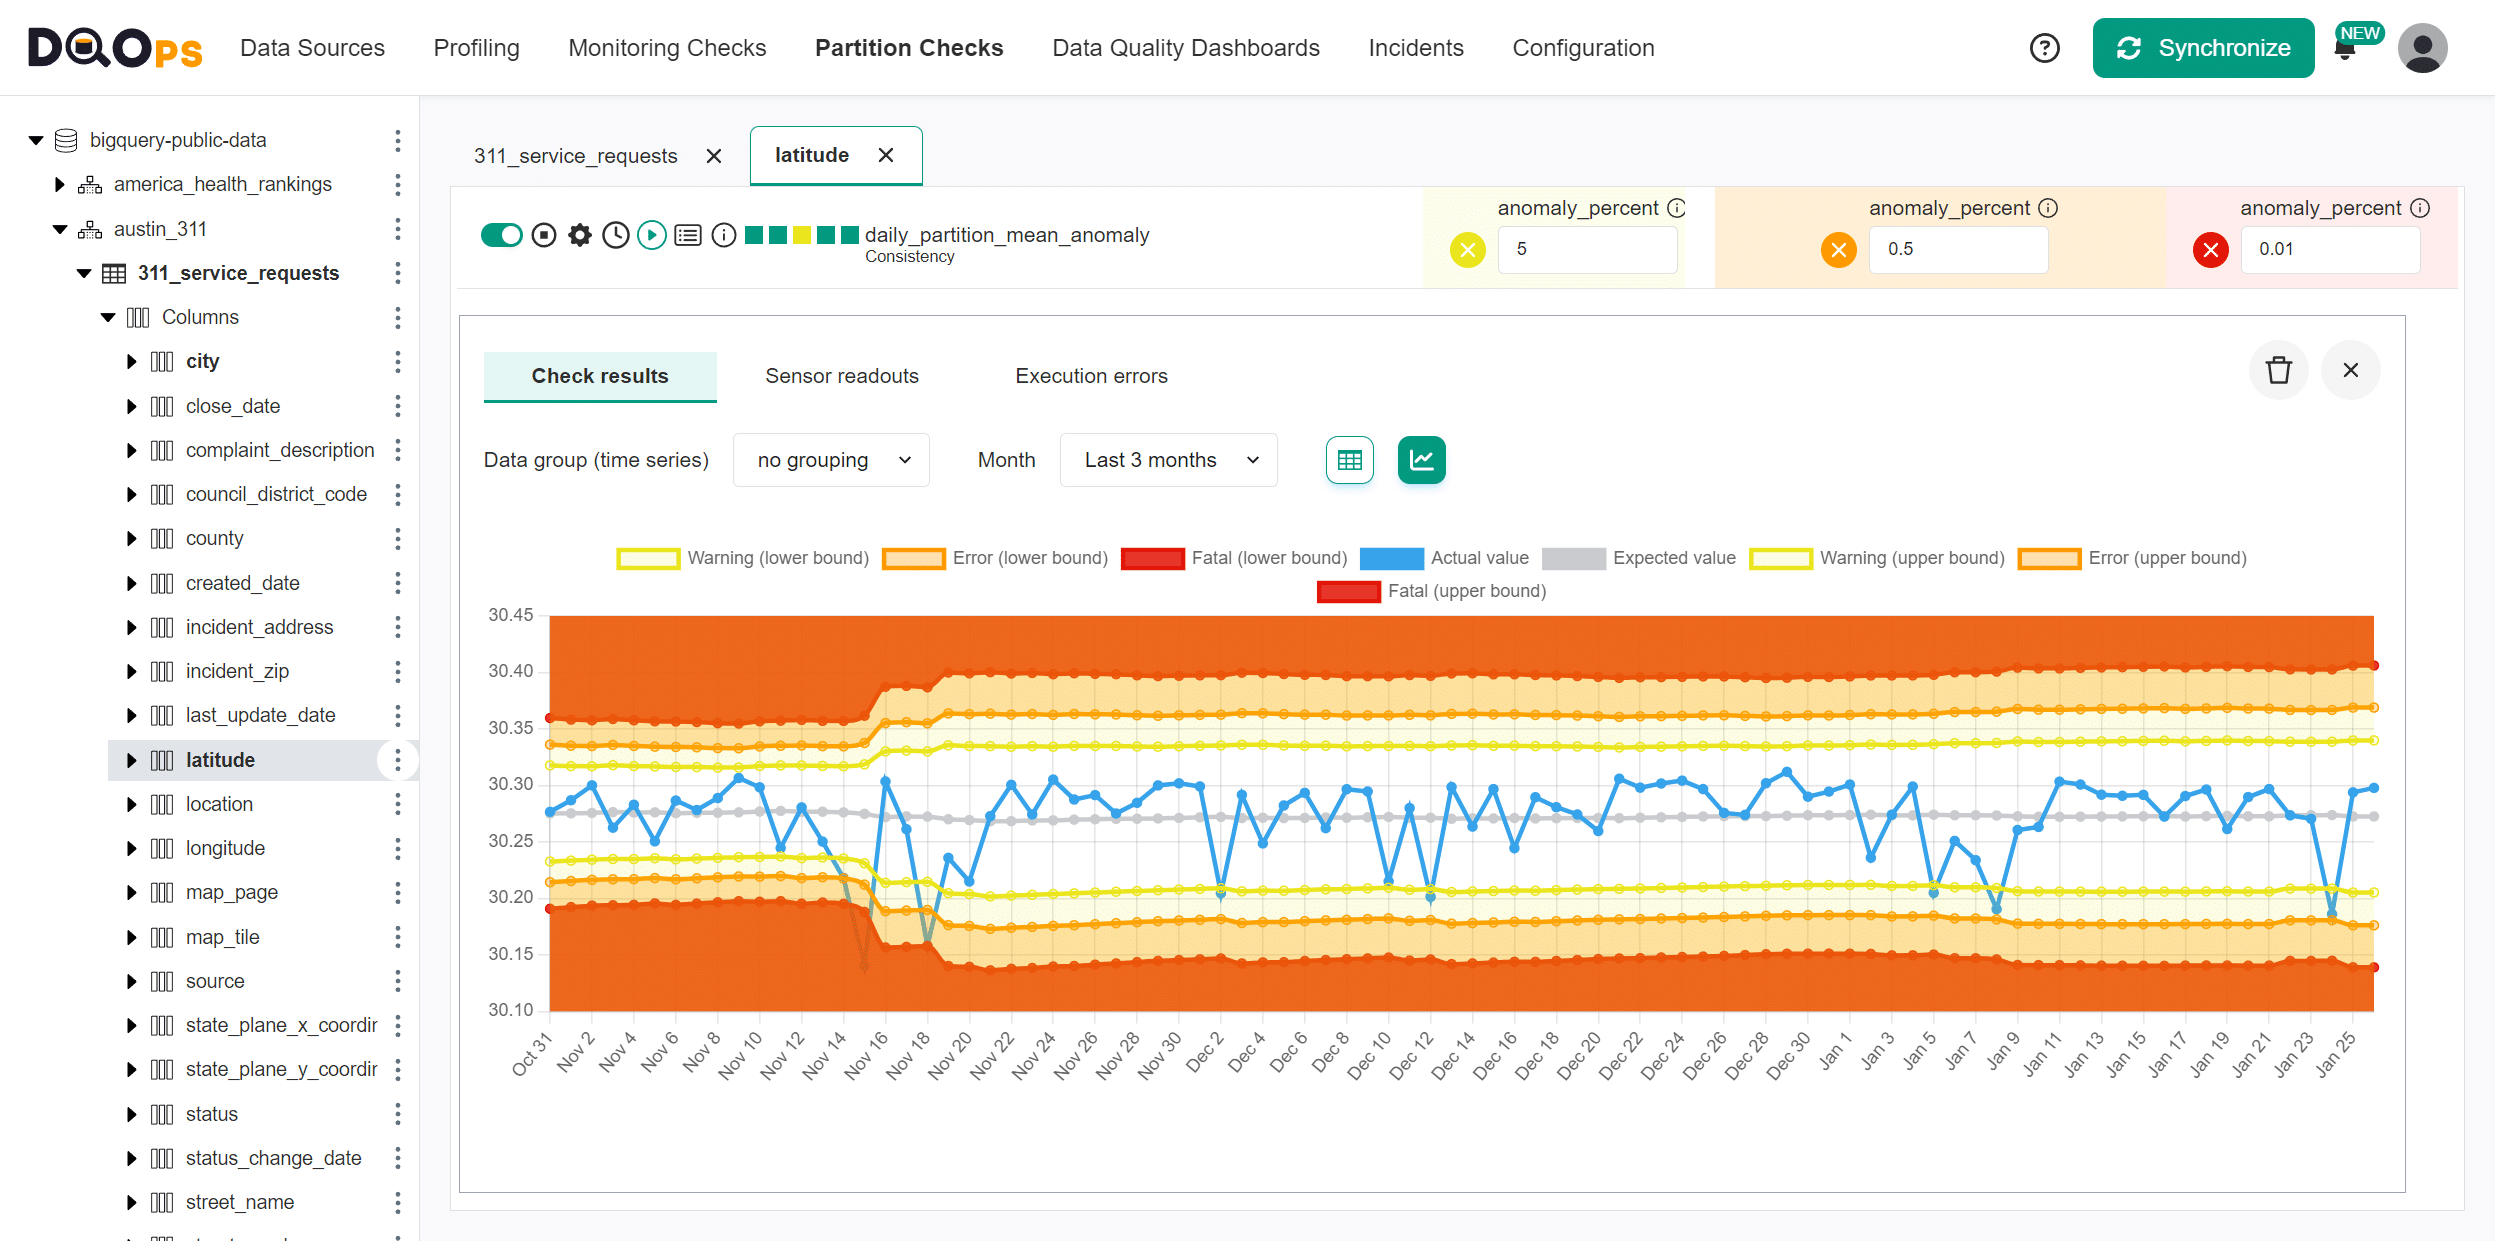
DQOps raises more data quality issues than the expected percent of anomalies. The reason is that the historical data is limited to ninety days, and the measures do not fit a Gaussian distribution. If you face the same problem, change the rule parameter anomaly_percent.
Date partitioned and monitoring checks
DQOps has two types of anomaly detection data quality checks.
-
Monitoring checks always analyze all rows in the table, finding a new minimum, maximum, sum, mean, or median value of all records. They can detect an anomaly only when a new outlier appears in the table, significantly changing the total measure of all rows.
-
Partition checks analyze daily partitions or simply groups of rows for the same date. Anomaly detection checks on a partition level calculate a minimum, maximum, sum, mean, or median measure for all daily partitions. DQOps compares the daily partition measure with the previous days' values. Partition anomaly checks detect issues earlier and are not affected by invalid values that are very old and will never be cleansed.
Other types of data anomalies
DQOps also detects anomalies in the data volume. Please refer to the data volume anomalies reference to learn how to detect row count changes or an inconsistent number of rows in daily partitions.
List of anomaly checks at a column level
| Data quality check name | Data quality dimension | Description | Standard check |
|---|---|---|---|
| sum_anomaly | Consistency | This check calculates a sum of values in a numeric column and detects anomalies in a time series of previous sums. It raises a data quality issue when the sum is in the top anomaly_percent percentage of the most outstanding values in the time series. This data quality check uses a 90-day time window and requires a history of at least 30 days. | |
| mean_anomaly | Consistency | This check calculates a mean (average) of values in a numeric column and detects anomalies in a time series of previous averages. It raises a data quality issue when the mean is in the top anomaly_percent percentage of the most outstanding values in the time series. This data quality check uses a 90-day time window and requires a history of at least 30 days. | |
| median_anomaly | Consistency | This check calculates a median of values in a numeric column and detects anomalies in a time series of previous medians. It raises a data quality issue when the median is in the top anomaly_percent percentage of the most outstanding values in the time series. This data quality check uses a 90-day time window and requires a history of at least 30 days. | |
| min_anomaly | Consistency | This check finds a minimum value in a numeric column and detects anomalies in a time series of previous minimum values. It raises a data quality issue when the current minimum value is in the top anomaly_percent percentage of the most outstanding values in the time series (it is a new minimum value, far from the previous one). This data quality check uses a 90-day time window and requires a history of at least 30 days. | |
| max_anomaly | Consistency | This check finds a maximum value in a numeric column and detects anomalies in a time series of previous maximum values. It raises a data quality issue when the current maximum value is in the top anomaly_percent percentage of the most outstanding values in the time series (it is a new maximum value, far from the previous one). This data quality check uses a 90-day time window and requires a history of at least 30 days. | |
| mean_change | Consistency | This check detects that the mean (average) of numeric values has changed more than max_percent from the last measured mean. | |
| mean_change_1_day | Consistency | This check detects that the mean (average) of numeric values has changed more than max_percent from the mean value measured one day ago (yesterday). | |
| mean_change_7_days | Consistency | This check detects that the mean (average) value of numeric values has changed more than max_percent from the mean value measured seven days ago. This check aims to overcome a weekly seasonability and compare Mondays to Mondays, Tuesdays to Tuesdays, etc. | |
| mean_change_30_days | Consistency | This check detects that the mean (average) of numeric values has changed more than max_percent from the mean value measured thirty days ago. This check aims to overcome a monthly seasonability and compare a value to a similar value a month ago. | |
| median_change | Consistency | This check detects that the median of numeric values has changed more than max_percent from the last measured median. | |
| median_change_1_day | Consistency | This check detects that the median of numeric values has changed more than max_percent from the median value measured one day ago (yesterday). | |
| median_change_7_days | Consistency | This check detects that the median of numeric values has changed more than max_percent from the median value measured seven days ago. This check aims to overcome a weekly seasonability and compare Mondays to Mondays, Tuesdays to Tuesdays, etc. | |
| median_change_30_days | Consistency | This check detects that the median of numeric values has changed more than max_percent from the median value measured thirty days ago. This check aims to overcome a monthly seasonability and compare a value to a similar value a month ago. | |
| sum_change | Consistency | This check detects that the sum of numeric values has changed more than max_percent from the last measured sum. | |
| sum_change_1_day | Consistency | This check detects that the sum of numeric values has changed more than max_percent from the sum measured one day ago (yesterday). | |
| sum_change_7_days | Consistency | This check detects that the sum of numeric values has changed more than max_percent from the sum measured seven days ago. This check aims to overcome a weekly seasonability and compare Mondays to Mondays, Tuesdays to Tuesdays, etc. | |
| sum_change_30_days | Consistency | This check detects that the sum of numeric values has changed more than max_percent from the sum measured thirty days ago. This check aims to overcome a monthly seasonability and compare a value to a similar value a month ago. |
Reference and samples
The full list of all data quality checks in this category is located in the column/anomaly reference. The reference section provides YAML code samples that are ready to copy-paste to the .dqotable.yaml files, the parameters reference, and samples of data source specific SQL queries generated by data quality sensors that are used by those checks.
What's next
- Learn how to run data quality checks filtering by a check category name
- Learn how to configure data quality checks and apply alerting rules
- Read the definition of data quality dimensions used by DQOps