Last updated: April 23, 2024
DQOps Data Quality Operations Center overview
What is DQOps Data Quality Operations Center?
What is DQOps Data Quality Operations Center
An open-source data quality platform for the whole data platform lifecycle
from profiling new data sources to automating data quality monitoring
The approach to managing data quality changes throughout the data lifecycle.
The preferred interface for a data quality platform also changes:
user interface, Python code, REST API, command-line, editing YAML files, running locally, or setting up a shared server.
DQOps supports them all.
-
Evaluating new data sources
Data scientists and data analysts want to review the data quality of new data sources or understand the data present on the data lake by profiling data.
-
Creating data pipelines
The data engineering teams want to verify data quality checks required by the Data Contract on both source and transformed data.
-
Testing data
An organization has a dedicated data quality team that handles quality assurance for data platforms. Data quality engineers want to evaluate all sorts of data quality checks.
-
Operations
The data platform matures and transitions to a production stage. The data operations team watches for schema changes and data changes that make the data unusable.
DQOps follows the process and enables a smooth transition from evaluating new data sources through creating data pipelines to finally daily monitoring of data to detect data quality issues.
-
The data analysts and data scientists profile their data sources in DQOps
-
Data engineers integrate data quality checks into data pipelines by calling DQOps
-
Every day, DQOps runs data quality checks selected during data profiling to verify that the data is still valid
-
DQOps is also a Data Observability platform that detects schema changes, data anomalies, volume fluctuations, or any other data quality check enabled by check patterns
How DQOps helps all data stakeholders?
-
Data Scientists and Data Analysts
As a data consumer, you need a data quality platform where you can perform data profiling of new data before you use them for analytics. The platform should be extensible because you may have many ideas about custom data quality checks, or even using machine learning to detect anomalies in data.
DQOps has over 150+ built-in data quality checks, created as templated Jinja2 SQL queries and validated by Python data quality rules. You can design custom data quality checks that the data quality team will supervise, and the checks will be visible in the user interface.
Profile the data quality of new datasets with 150+ data quality checks
-
Data Engineering
The data engineers need a data quality platform that can integrate with the data pipeline code. When a severe data quality issue is detected in a source table, the data pipelines should be stopped and resumed when the problem is fixed. The data quality code should also be easy to version with Git, and modify the configuration without corrupting any file.
DQOps does not use a database to store the configuration. Instead, all data quality configuration files are stored in YAML files. The platform also provides a Python Client to automate any operation visible in the user interface.
Configure data quality checks in code, with code completion
Run data quality checks from data pipelines using a Python client
-
Data Quality Operations
If you plan to create a data quality operations team or designate an individual as a data quality specialist, you need a platform that can support them. The data quality operations team will configure data quality checks, review detected data quality incidents, and forward them to the data engineers or a data source platform owner.
DQOps comes with a built-in user interface designed to manage the whole process in one place, allowing you to review multiple data quality issues and tables at the same time.
Configure data quality checks in the user interface
-
Business Sponsors
No data quality project can be started without the support of the top management and business sponsors. You need to gain their trust that investing in data quality was worth it. Your business sponsors, external vendors that share data with you need to see a reliable data quality score that they understand and trust.
DQOps measures data quality with Data Quality KPIs. Every user receives a complimentary Data Quality Data Warehouse hosted by DQOps, and can review the data quality status on data quality dashboards. DQOps even supports custom data quality dashboards.
Track the current data quality status with data quality dashboards
Supported data sources
SQL engines
Flat files
Getting started
Start with DQOps
-
Follow the DQOps tutorial to set up the platform, or simply see the whole data quality process with DQOps on examples.
-
Categories of data quality checks
Find out what types of most common data quality issues DQOps can detect. The manual for each category shows how to activate the check.
-
Download from PyPI or Docker Hub
DQOps is open-source that you can start on your computer right now. Only the complimentary Data Quality Dashboards are hosted by DQOps.
Features
Data quality checks
DQOps uses data quality checks to capture metrics from data sources and detect data quality issues.
Data profiling
Profile data
DQOps has two methods of data profiling. The first step is capturing basic data statistics.
When you know how the table is structured, you can experiment with profiling data quality checks and verify the initial data quality KPI score on data quality dashboards.
Data quality monitoring
Run scheduled data quality checks
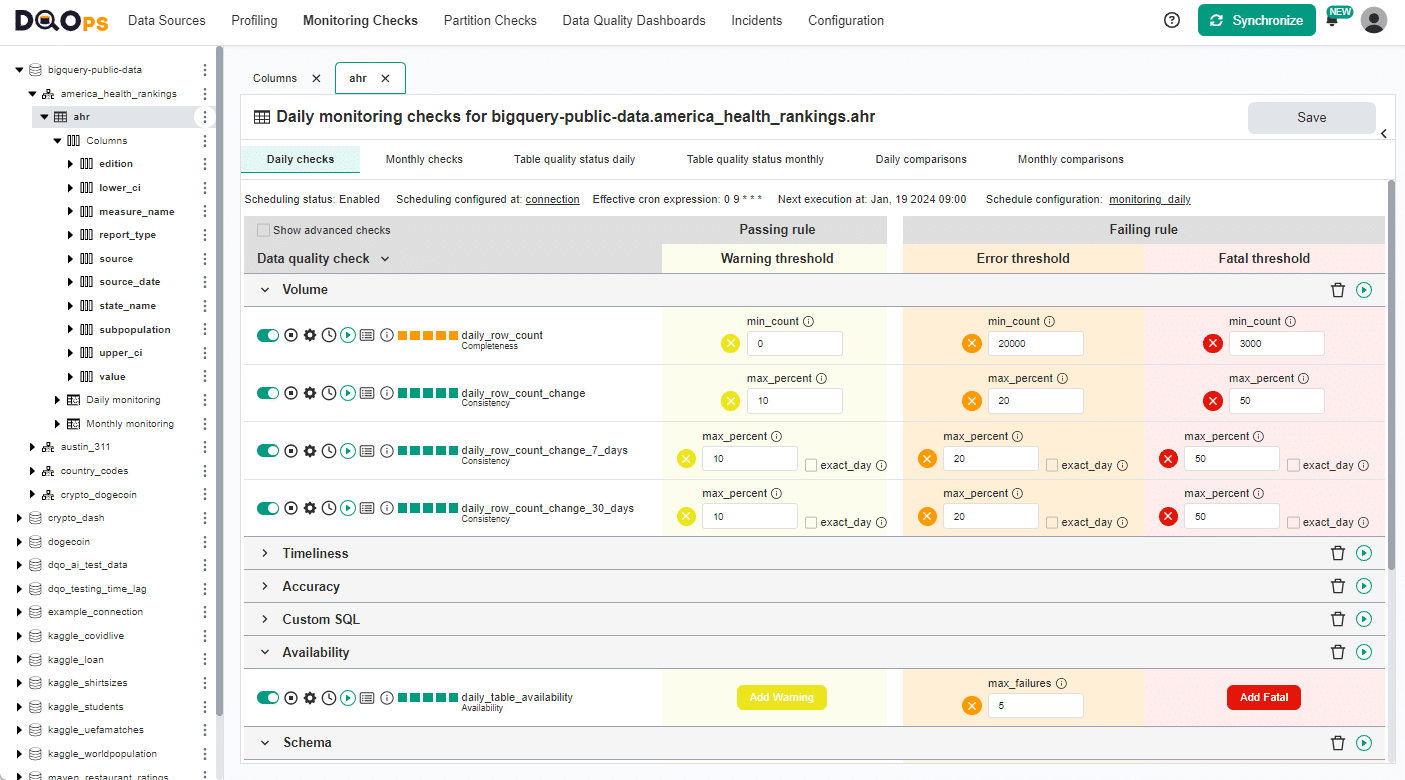
DQOps user interface is designed to resemble popular database management tools. The data sources, tables and columns are on the left. The workspace in the center shows tables and columns in tabs, which allows you to open multiple objects and edit many tables at once.
The data quality check editor shows both the built-in data quality checks and custom data quality checks that you can define in DQOps.
There are other methods to activate data quality checks. You can:
Configure data quality checks in YAML
Anomaly detection
Detect data anomalies
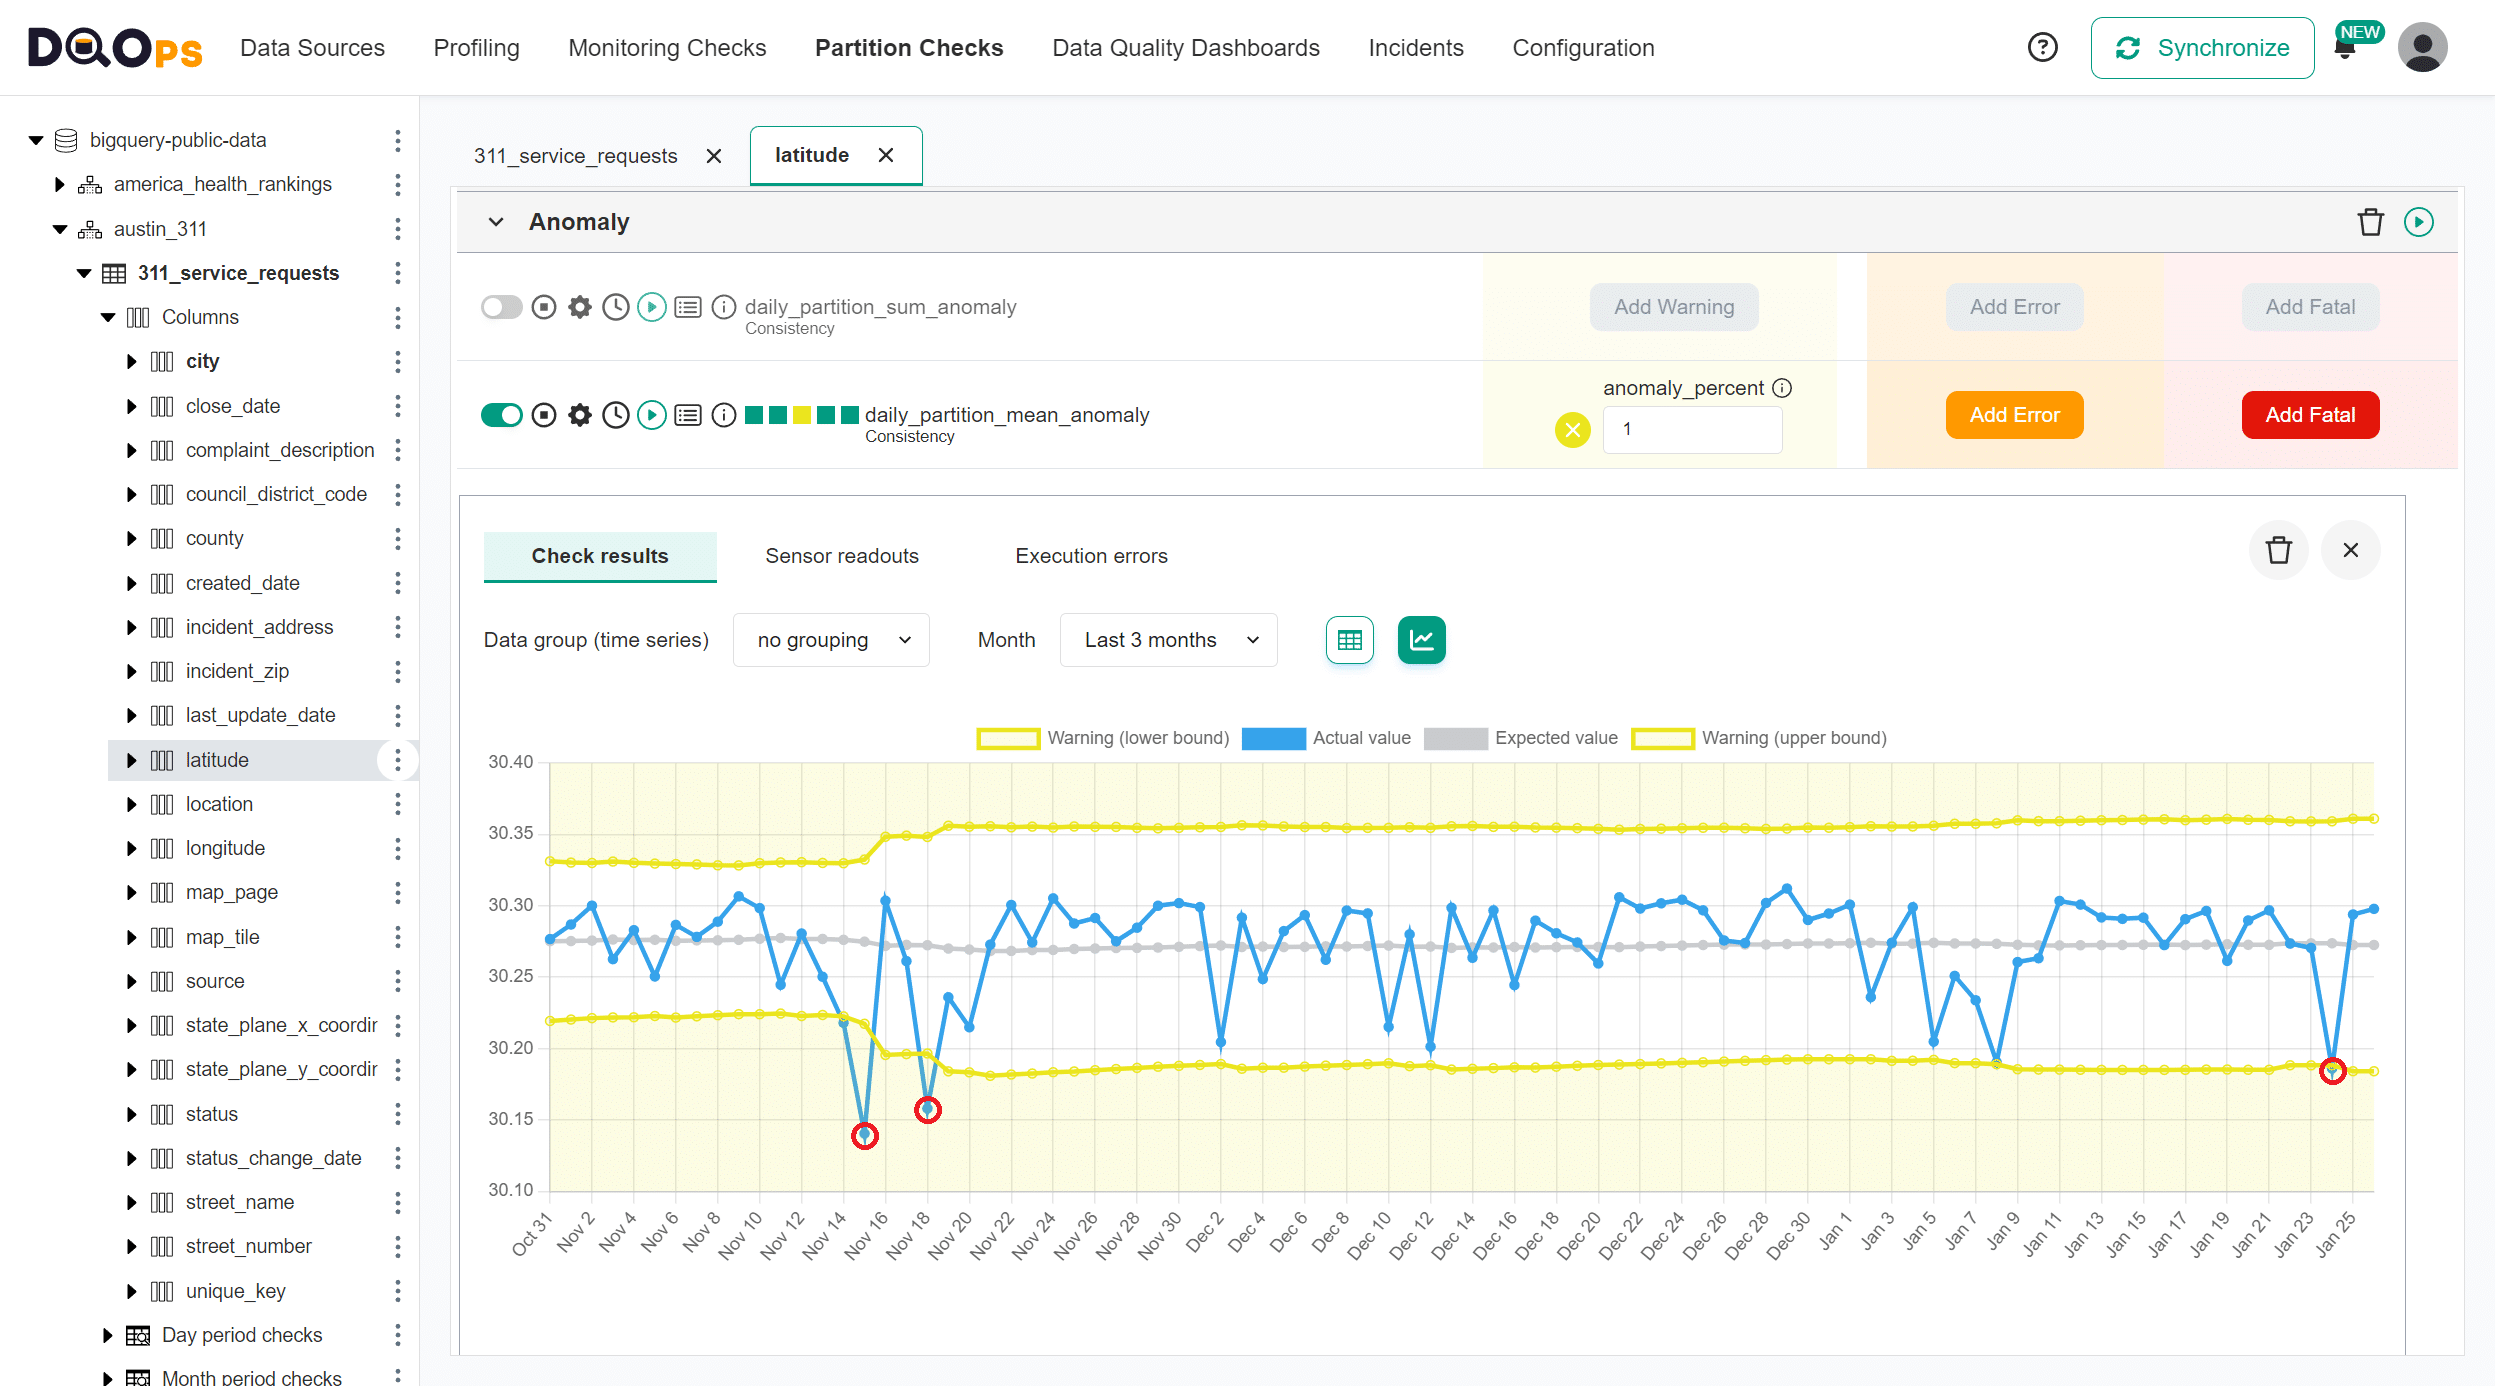
All historical metrics, such as a row count, minimum, maximum, and median value, are stored locally to allow time series prediction.
Detect outliers such as new minimum or maximum values. Compare metrics such as a sum of values between daily partitions. Detect anomalies between daily partitions, such as an unexpected increase in the number of rows in a partition.
DQOps detects the following types of data anomalies:
Data quality dashboards
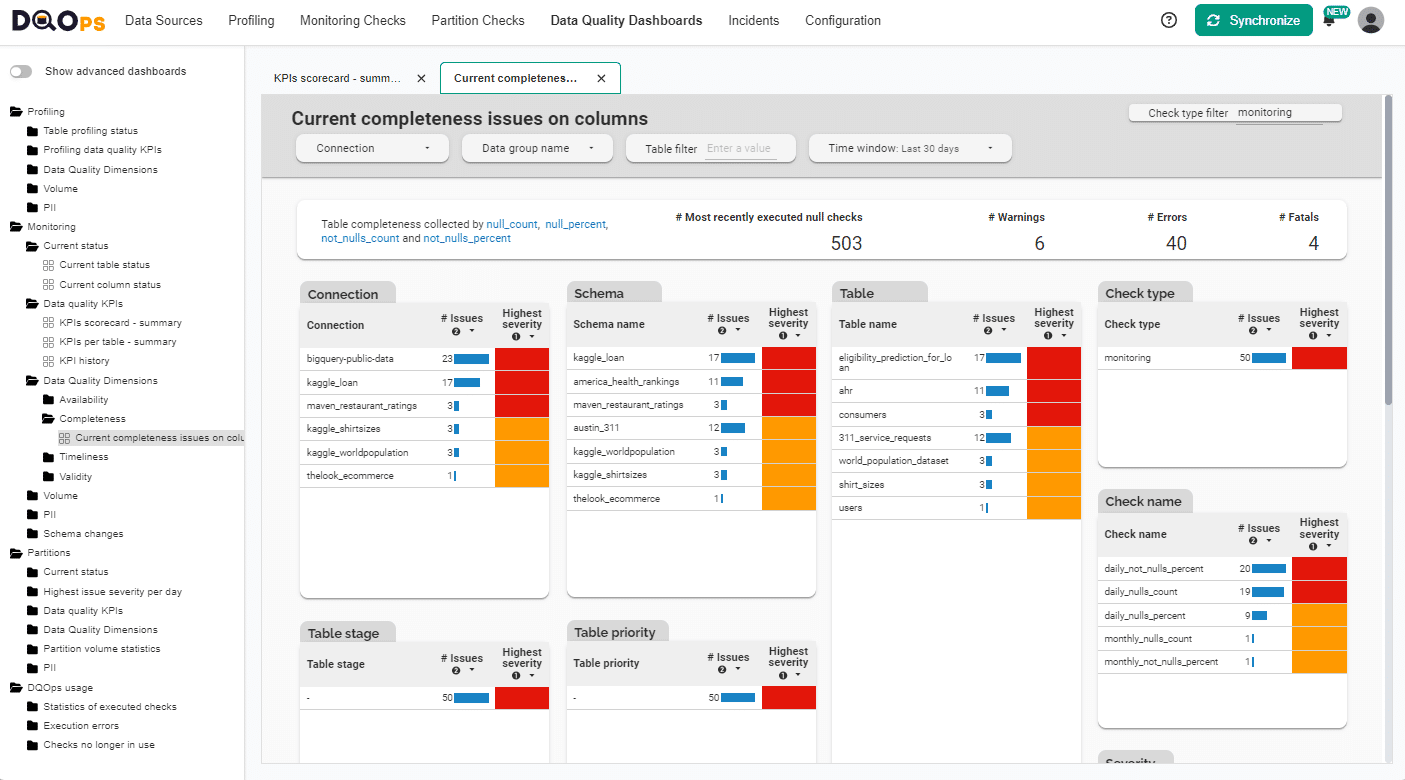
Over 50 built-in data quality dashboards let you drill-down to the problem.
Data quality KPIs
Review data quality KPI scores
DQOps measures data quality using a data quality KPI score. The formula is simple and trustworthy, the KPI is the percentage of passed data quality checks.
DQOps presents the data quality KPI scores for each month, showing the progress in data quality to business sponsors.
Data quality KPIs are also a great way to assess the initial data quality KPI score after profiling new data sources to identify areas for improvement.
Data quality KPI score formula
Data quality dashboards
Track quality on data quality dashboards
DQOps provides a complimentary Data Quality Data Warehouse for every user. The data quality check results captured when monitoring data quality are first stored locally on your computer in a Hive-compliant data lake.
DQOps synchronizes the data to a complimentary Data Quality Data Warehouse that is accessed using a DQOps Looker Studio connector. You can even create custom data quality dashboards.
Types of data quality dashboards
Creating custom data quality dashboards
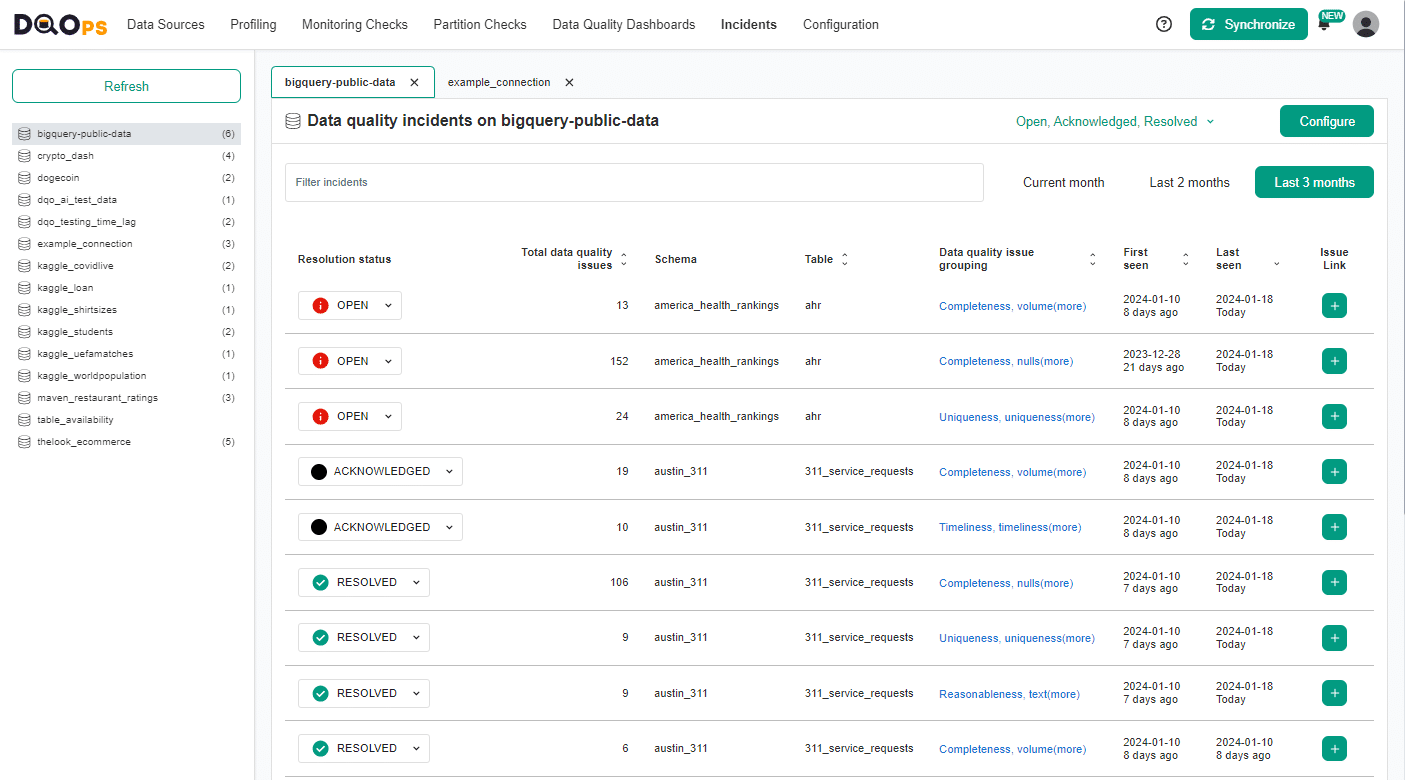
Data quality incidents
React to data quality incidents and assign them to the right teams who can fix the problem.
Data quality incident management
Data quality incident workflows
Organizations have separated operations team that react to data quality incidents first, and engineering teams that can fix the problems. The data engineering teams should not be engaged before the data quality issue is confirmed.
DQOps reduces the effort of monitoring data quality by grouping similar data quality issues into data quality incidents.
DQOps uses a data quality incident workflow to
create new incidents as OPEN when a new incident is detected. This allows the data quality operations team to review the problem
and assign ACKNOWLEDGED incidents to data engineering.
Data quality incident workflow
Sending notifications to slack
Sending notifications to any ticketing platform using webhooks
DQOps is DevOps and DataOps friendly
Technical users can manage data quality check configuration at scale by changing YAML files in their editor of choice
and version the configuration in Git. An example below shows how to configure the profile_nulls_count
data quality check in a DQOps YAML file that you can version in Git.
# yaml-language-server: $schema=https://cloud.dqops.com/dqo-yaml-schema/TableYaml-schema.json
apiVersion: dqo/v1
kind: table
spec:
  columns:
    target_column_name:
      profiling_checks:
        nulls:
          profile_nulls_count:
            warning:
              max_count: 0
            error:
              max_count: 10
            fatal:
              max_count: 100
      labels:
      - This is the column that is analyzed for data quality issues
See how DQOps supports editing data quality configuration files in Visual Studio Code, validating the structure of files, suggesting data quality checks names and parameters, and even showing the help about 150+ data quality checks inside Visual Studio Code.
You can also run data quality checks from data pipelines, and integrate data quality into Apache Airflow using our REST API Python client.
Competitive advantages
-
Analyze very big tables
DQOps supports incremental data quality monitoring to detect issues only in new data. Additionally, DQOps merges multiple data quality queries into bigger queries to avoid pressure on the monitored data source.
-
Analyze partitioned data
DQOps can run data quality queries with a GROUP BY date_column to analyze partitioned data. You can get a data quality score for every partition.
-
Compare tables
Data reconciliation is a process of comparing tables to the source-of-truth. DQOps compares tables across data sources, even if the tables are transformed. You can compare a large fact table to a summary table received from the finance department.
-
Segment data by data streams
What if your table contains aggregated data that was received from different suppliers, departments, vendors, or teams? Data quality issues are detected, but who provided you the corrupted data? DQOps answers the question by running data quality checks with grouping, supporting a hierarchy of up to 9 levels.
Use GROUP BY to measure data quality for different data streams
-
Define custom data quality checks
A dashboard is showing the wrong numbers. The business sponsor asks you to monitor it every day to detect when it will show the wrong numbers. You can take the SQL query from the dashboard and turn it into a templated data quality check that DQOps shows on the user interface.
Additional resources
Want to learn more about data quality?
Reaching 100% data quality KPI score
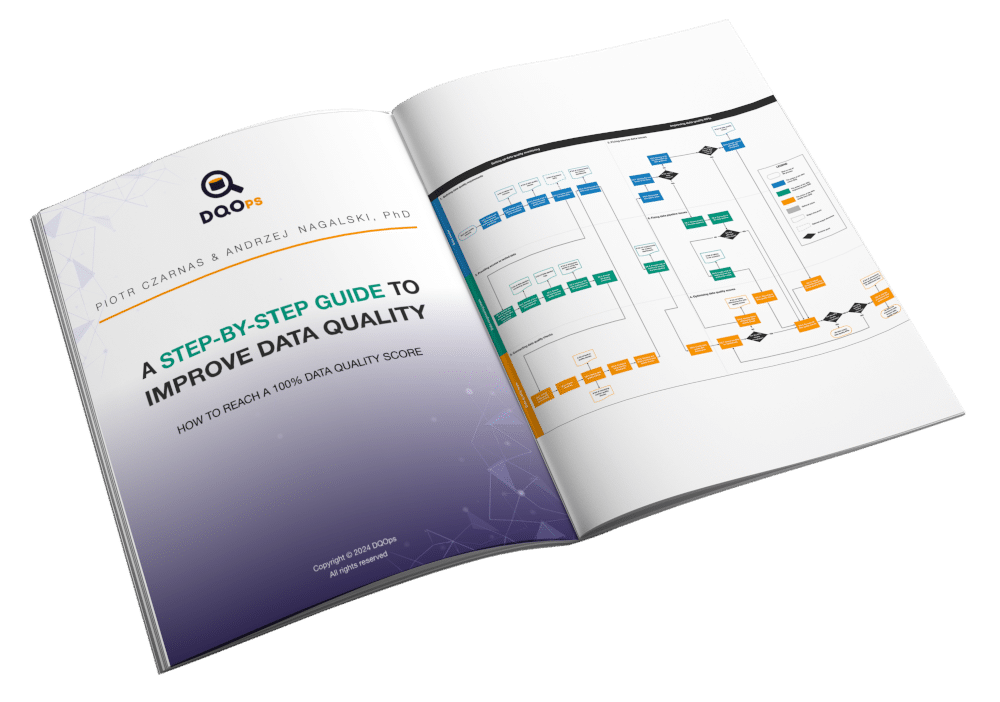
DQOps creators have written an eBook "A step-by-step guide to improve data quality" that describes their experience in data cleansing and data quality monitoring using DQOps.
The eBook desribes a full data quality improvement process that allows to reach a ~100% data quality KPI score within 6-12 months. Download the eBook to learn the process of managing an iterative data quality project that leads to fixing all data quality issues.
Click to zoom in


